## Line Chart: NLL vs Sequence Position for Pro and Ultra
### Overview
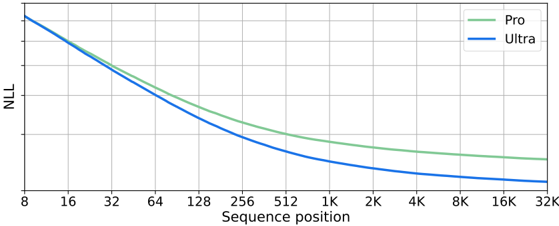
The image is a line chart comparing the Negative Log Likelihood (NLL) of two models, "Pro" and "Ultra", across different sequence positions. The x-axis represents the sequence position, ranging from 8 to 32K, and the y-axis represents the NLL. The chart shows how the NLL changes as the sequence position increases for both models.
### Components/Axes
* **Title:** There is no explicit title on the chart.
* **X-axis:**
* Label: "Sequence position"
* Scale: Logarithmic, with markers at 8, 16, 32, 64, 128, 256, 512, 1K, 2K, 4K, 8K, 16K, and 32K.
* **Y-axis:**
* Label: "NLL"
* Scale: Linear, with no explicit numerical markers shown, but the range appears to be from approximately 0 to a value slightly above where the "Pro" line starts.
* **Legend:** Located in the top-right corner.
* "Pro": Represented by a light green line.
* "Ultra": Represented by a blue line.
### Detailed Analysis
* **Pro (Light Green Line):**
* Trend: The NLL decreases as the sequence position increases. The rate of decrease is higher at lower sequence positions and gradually flattens out as the sequence position increases.
* Approximate Data Points:
* At 8: NLL ≈ 0.85
* At 16: NLL ≈ 0.7
* At 32: NLL ≈ 0.55
* At 64: NLL ≈ 0.45
* At 128: NLL ≈ 0.35
* At 256: NLL ≈ 0.3
* At 512: NLL ≈ 0.25
* At 1K: NLL ≈ 0.22
* At 2K: NLL ≈ 0.2
* At 4K: NLL ≈ 0.18
* At 8K: NLL ≈ 0.17
* At 16K: NLL ≈ 0.16
* At 32K: NLL ≈ 0.15
* **Ultra (Blue Line):**
* Trend: The NLL decreases as the sequence position increases. The rate of decrease is higher at lower sequence positions and gradually flattens out as the sequence position increases. The "Ultra" line is consistently below the "Pro" line.
* Approximate Data Points:
* At 8: NLL ≈ 0.75
* At 16: NLL ≈ 0.6
* At 32: NLL ≈ 0.45
* At 64: NLL ≈ 0.35
* At 128: NLL ≈ 0.25
* At 256: NLL ≈ 0.2
* At 512: NLL ≈ 0.15
* At 1K: NLL ≈ 0.13
* At 2K: NLL ≈ 0.11
* At 4K: NLL ≈ 0.10
* At 8K: NLL ≈ 0.09
* At 16K: NLL ≈ 0.08
* At 32K: NLL ≈ 0.07
### Key Observations
* Both "Pro" and "Ultra" models exhibit a decreasing NLL as the sequence position increases.
* The "Ultra" model consistently has a lower NLL than the "Pro" model across all sequence positions.
* The difference in NLL between the two models is more pronounced at lower sequence positions.
* The rate of decrease in NLL diminishes as the sequence position increases for both models.
### Interpretation
The chart suggests that both models perform better (lower NLL) with longer sequence positions. The "Ultra" model consistently outperforms the "Pro" model, indicating that it is a better model in terms of negative log-likelihood. The diminishing rate of decrease in NLL suggests that there are diminishing returns to increasing the sequence position beyond a certain point. The "Ultra" model's superior performance is more evident at shorter sequence lengths, implying it might be more efficient or better optimized for handling shorter sequences compared to the "Pro" model.