## Line Graph: NLL vs Sequence Position
### Overview
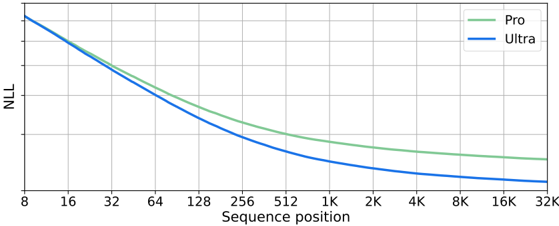
The image is a line graph comparing the Negative Log Likelihood (NLL) performance of two models, "Pro" (green line) and "Ultra" (blue line), across sequence positions ranging from 8 to 32K. Both lines show a decreasing trend, with "Pro" starting higher than "Ultra" but ending lower, indicating a crossover point.
### Components/Axes
- **X-axis (Horizontal)**: Labeled "Sequence position" with logarithmic scale markers at 8, 16, 32, 64, 128, 256, 512, 1K, 2K, 4K, 8K, 16K, 32K.
- **Y-axis (Vertical)**: Labeled "NLL" with linear scale markers from 0 to 16.
- **Legend**: Located in the top-right corner, with "Pro" (green line) and "Ultra" (blue line) labeled.
### Detailed Analysis
- **Pro (Green Line)**:
- Starts at ~14 NLL at 8K sequence position.
- Decreases steeply to ~8 NLL at 16K.
- Flattens to ~4 NLL at 32K.
- **Ultra (Blue Line)**:
- Starts at ~12 NLL at 8K.
- Decreases gradually to ~6 NLL at 16K.
- Flattens to ~3 NLL at 32K.
- **Crossover Point**: The lines intersect near the 16K sequence position, where both models have ~8 NLL.
### Key Observations
1. **Initial Performance**: "Ultra" begins with lower NLL than "Pro" at shorter sequence positions (e.g., 8K, 16K).
2. **Long-Term Efficiency**: "Pro" outperforms "Ultra" at longer sequence positions (e.g., 32K), with a ~1 NLL advantage.
3. **Trend Divergence**: The gap between the lines narrows after 16K, suggesting diminishing returns for both models at extreme sequence lengths.
### Interpretation
The graph demonstrates that "Pro" is more effective than "Ultra" for processing longer sequences, as its NLL reduction accelerates beyond the 16K mark. This could imply architectural advantages in "Pro" for handling extended data, such as optimized memory usage or computational efficiency. The crossover point highlights a critical threshold where "Pro" becomes the superior choice, potentially guiding deployment decisions based on sequence length requirements. No anomalies or outliers are observed; both lines follow smooth, predictable trends.