## Causal Diagram: Test Score Influences
### Overview
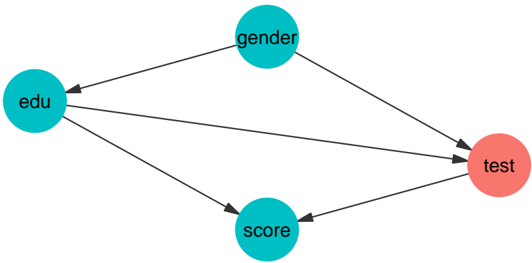
The image is a causal diagram illustrating the relationships between several variables: education (edu), gender, score, and test. The diagram uses nodes (circles) to represent variables and directed edges (arrows) to represent causal influences.
### Components/Axes
* **Nodes:**
* `edu` (education): Located on the left side of the diagram, colored turquoise.
* `gender`: Located at the top-center of the diagram, colored turquoise.
* `score`: Located at the bottom-center of the diagram, colored turquoise.
* `test`: Located on the right side of the diagram, colored salmon.
* **Edges:** Directed edges (arrows) indicate the direction of causal influence.
### Detailed Analysis or ### Content Details
The diagram shows the following relationships:
* `gender` -> `edu`: An arrow points from `gender` to `edu`, indicating that gender influences education.
* `gender` -> `test`: An arrow points from `gender` to `test`, indicating that gender influences test scores.
* `edu` -> `test`: An arrow points from `edu` to `test`, indicating that education influences test scores.
* `score` -> `edu`: An arrow points from `score` to `edu`, indicating that score influences education.
* `score` -> `test`: An arrow points from `score` to `test`, indicating that score influences test scores.
### Key Observations
* `test` is the outcome variable, influenced by all other variables.
* `edu` is influenced by both `gender` and `score`.
* `gender` and `score` directly influence `test`.
### Interpretation
The diagram suggests a causal model where gender and score directly influence test scores, and also indirectly influence test scores through their effect on education. Education itself also directly influences test scores. This model could be used to analyze the factors that contribute to test performance and to understand the relationships between these factors.