\n
## Diagram: Causal Relationship Model
### Overview
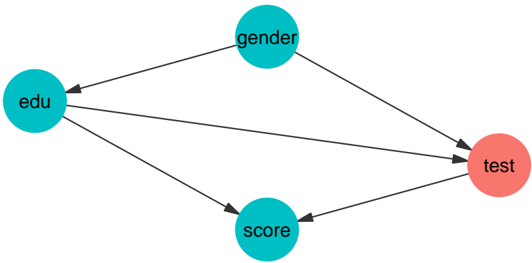
The image depicts a directed acyclic graph illustrating potential causal relationships between four variables: "edu", "gender", "score", and "test". The nodes are represented as circles, and the relationships are shown as directed arrows. The diagram does not contain numerical data, but rather a structural representation of hypothesized influences.
### Components/Axes
The diagram consists of four labeled nodes:
* **edu**: Represented by a teal circle, positioned on the left side of the diagram.
* **gender**: Represented by a teal circle, positioned above and slightly to the right of "edu".
* **score**: Represented by a teal circle, positioned below and slightly to the right of "edu".
* **test**: Represented by a salmon-colored circle, positioned on the right side of the diagram.
Arrows connect these nodes, indicating the direction of the hypothesized causal influence.
### Detailed Analysis or Content Details
The following relationships are depicted:
1. **edu -> gender**: An arrow points from "edu" to "gender", suggesting that education level may influence gender (or the perception/reporting of gender).
2. **edu -> test**: An arrow points from "edu" to "test", suggesting that education level may influence the "test" outcome.
3. **gender -> test**: An arrow points from "gender" to "test", suggesting that gender may influence the "test" outcome.
4. **edu -> score**: An arrow points from "edu" to "score", suggesting that education level may influence the "score".
5. **score -> test**: An arrow points from "score" to "test", suggesting that the "score" may influence the "test" outcome.
### Key Observations
The diagram suggests a model where "test" is influenced by multiple factors: education, gender, and score. "Score" itself is influenced by education. "Gender" is influenced by education. The diagram does not specify the nature of the "test" or "score" variables.
### Interpretation
This diagram represents a hypothesized causal model. It suggests that education is a foundational variable influencing both gender and score, which in turn influence the test outcome. The inclusion of "gender" as a variable influenced by "edu" is unusual and may indicate a specific theoretical framework or research question. The model implies that understanding the relationship between education, gender, score, and test results requires considering the interconnectedness of these variables. The diagram is a structural representation and does not provide any quantitative information about the strength or direction of these relationships. It is a conceptual model for further investigation.