## Diagram: Conceptual Relationship Model
### Overview
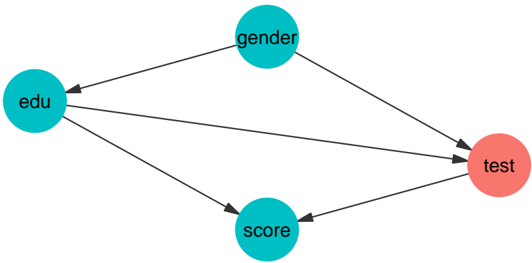
The image depicts a directed graph with four nodes connected by arrows, representing relationships between variables. The nodes are labeled "edu," "gender," "score," and "test," with "test" highlighted in red. Arrows indicate directional influence or dependency between nodes.
### Components/Axes
- **Nodes**:
- `edu` (teal): Positioned on the left.
- `gender` (teal): Positioned at the top.
- `score` (teal): Positioned at the bottom.
- `test` (red): Positioned on the right.
- **Arrows**:
- Black arrows connect nodes, indicating directional relationships.
- No legend is present, but node colors are explicitly labeled.
### Detailed Analysis
- **Node Connections**:
- `edu` → `gender` (direct influence).
- `edu` → `score` (direct influence).
- `edu` → `test` (direct influence).
- `gender` → `test` (direct influence).
- `score` → `test` (direct influence).
- **Color Coding**:
- Teal nodes (`edu`, `gender`, `score`) represent input or intermediate variables.
- Red node (`test`) represents the output or target variable.
### Key Observations
- The diagram emphasizes `test` as the central outcome, influenced by all other nodes.
- `edu` has the most outgoing connections, suggesting it is a foundational variable.
- No numerical values or quantitative data are present; the diagram is conceptual.
### Interpretation
This diagram illustrates a causal or dependency model where education (`edu`) impacts gender, academic performance (`score`), and test outcomes (`test`). Gender and score further mediate the relationship between education and test results. The red color of `test` may symbolize its importance as the final metric. The absence of numerical data implies this is a theoretical framework rather than an empirical analysis.
## Notes
- No numerical data, charts, or tables are present.
- The diagram uses spatial positioning to emphasize the hierarchy of influence (left-to-right flow).
- No textual annotations or legends beyond node labels and colors.