## Line Chart: Validation Loss vs LLM Size
### Overview
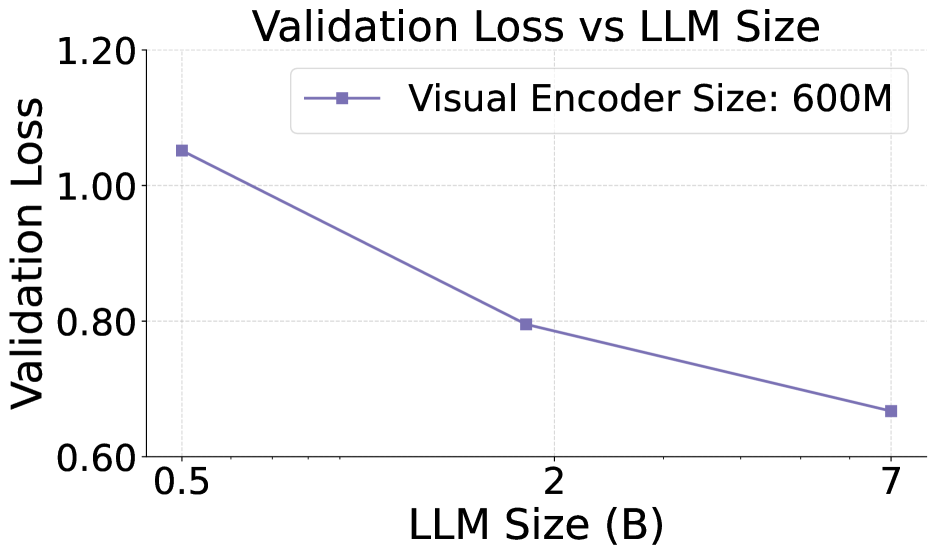
The image is a line chart that plots the validation loss against the LLM (Large Language Model) size. The chart shows how the validation loss decreases as the LLM size increases, for a fixed Visual Encoder Size of 600M.
### Components/Axes
* **Title:** Validation Loss vs LLM Size
* **X-axis:** LLM Size (B) - with values 0.5, 2, and 7
* **Y-axis:** Validation Loss - with values ranging from 0.60 to 1.20, in increments of 0.20.
* **Legend:** Located at the top-right of the chart. It indicates that the line represents "Visual Encoder Size: 600M". The line color is a muted purple.
### Detailed Analysis
The chart contains one data series, representing the validation loss for a visual encoder size of 600M.
* **Visual Encoder Size: 600M (muted purple line):**
* At LLM Size 0.5, the Validation Loss is approximately 1.05.
* At LLM Size 2, the Validation Loss is approximately 0.80.
* At LLM Size 7, the Validation Loss is approximately 0.67.
The line slopes downward, indicating a decreasing validation loss as the LLM size increases.
### Key Observations
* The validation loss decreases as the LLM size increases.
* The rate of decrease in validation loss appears to diminish as the LLM size gets larger.
### Interpretation
The chart suggests that increasing the LLM size (up to 7B) reduces the validation loss, indicating improved model performance. The diminishing rate of decrease suggests that there might be a point of diminishing returns, where further increases in LLM size yield smaller improvements in validation loss. The data is specific to a visual encoder size of 600M, and the relationship might differ for other encoder sizes.