\n
## Line Chart: Validation Loss vs LLM Size
### Overview
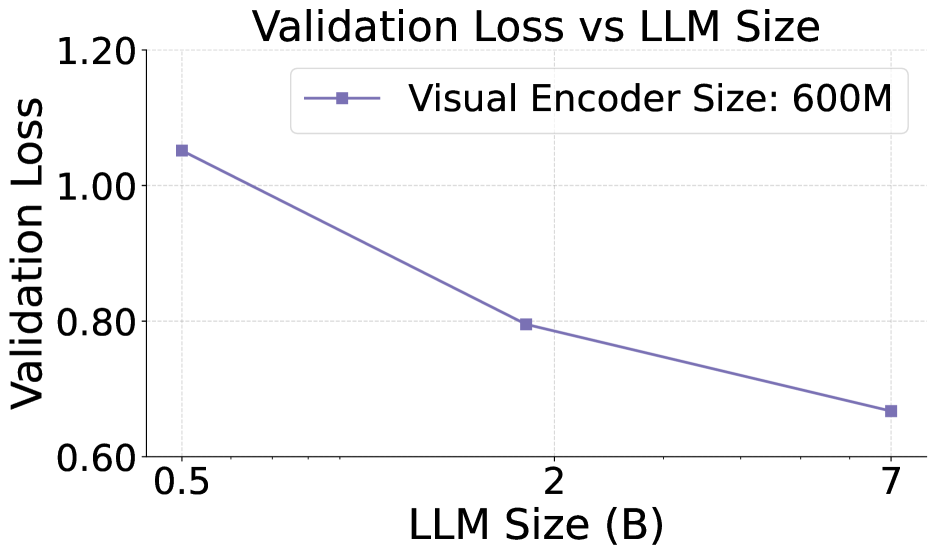
This chart depicts the relationship between Validation Loss and LLM Size, specifically for a Visual Encoder Size of 600M. The chart shows a decreasing trend, indicating that as the LLM size increases, the validation loss decreases.
### Components/Axes
* **Title:** "Validation Loss vs LLM Size" (centered at the top)
* **X-axis:** "LLM Size (B)" - ranging from approximately 0.5 to 7.0, with markers at 0.5, 2, and 7.
* **Y-axis:** "Validation Loss" - ranging from approximately 0.6 to 1.2, with markers at 0.6, 0.8, 1.0, and 1.2.
* **Legend:** Located in the top-right corner.
* "Visual Encoder Size: 600M" - associated with a solid purple line with square markers.
### Detailed Analysis
The chart contains a single data series representing the "Visual Encoder Size: 600M". The line slopes downward from left to right, indicating a negative correlation between LLM size and validation loss.
Here's a breakdown of the data points:
* **LLM Size = 0.5B:** Validation Loss ≈ 1.04 (± 0.02)
* **LLM Size = 2B:** Validation Loss ≈ 0.81 (± 0.02)
* **LLM Size = 7B:** Validation Loss ≈ 0.68 (± 0.02)
The data points are connected by a smooth, solid purple line.
### Key Observations
* The validation loss decreases significantly as the LLM size increases from 0.5B to 2B.
* The rate of decrease slows down as the LLM size increases from 2B to 7B.
* There are no apparent outliers or anomalies in the data.
### Interpretation
The data suggests that increasing the size of the LLM (up to 7B in this experiment) leads to a reduction in validation loss, indicating improved model performance. This is a common observation in deep learning, as larger models generally have a greater capacity to learn complex patterns. The diminishing returns observed between 2B and 7B suggest that there may be a point of diminishing returns, where further increasing the model size yields smaller improvements in performance. The consistent performance of the Visual Encoder at 600M suggests that this configuration is effective across the tested LLM sizes. This chart is likely part of a larger study investigating the optimal LLM size for a given visual encoding architecture.