# Technical Document Extraction: Validation Loss vs LLM Size
## 1. **Chart Title**
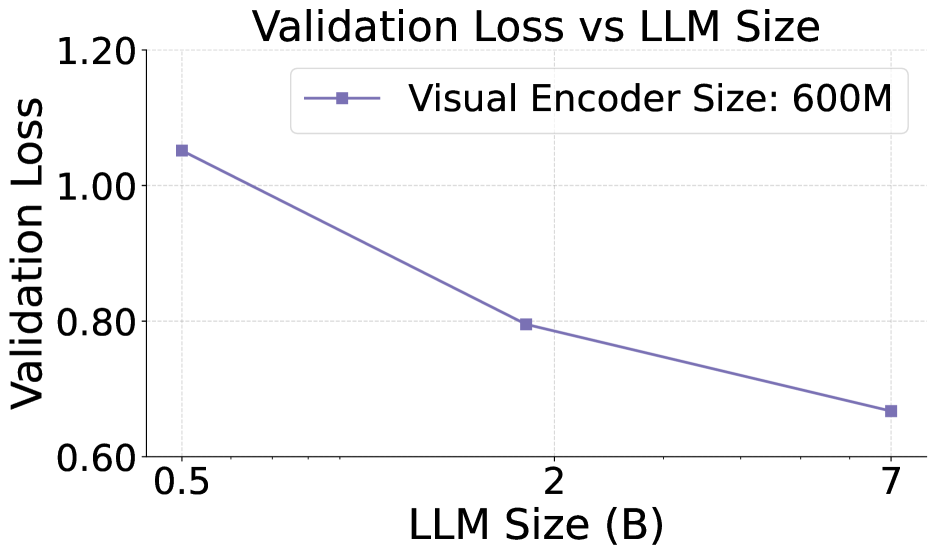
- **Text**: "Validation Loss vs LLM Size"
## 2. **Axis Labels**
- **X-Axis**:
- **Title**: "LLM Size (B)"
- **Markers**: 0.5, 2, 7
- **Y-Axis**:
- **Title**: "Validation Loss"
- **Range**: 0.60 to 1.20 (in increments of 0.20)
## 3. **Legend**
- **Location**: Top-right corner
- **Label**: "Visual Encoder Size: 600M"
- **Color**: Purple (matches line color)
## 4. **Line and Data Points**
- **Line Style**: Solid purple line with square markers
- **Data Points**:
- **[0.5, 1.05]**: Validation Loss = 1.05 at LLM Size = 0.5B
- **[2, 0.80]**: Validation Loss = 0.80 at LLM Size = 2B
- **[7, 0.65]**: Validation Loss = 0.65 at LLM Size = 7B
- **Trend**: Monotonic decrease in validation loss as LLM size increases
## 5. **Spatial Grounding**
- **Legend Position**: Top-right (confirmed via visual alignment)
- **Line Color Consistency**: Purple line matches legend color exactly
## 6. **Trend Verification**
- **Visual Trend**: Line slopes downward from left to right, confirming inverse relationship between LLM size and validation loss.
## 7. **Component Isolation**
- **Header**: Chart title centered at the top
- **Main Chart**:
- Axes with labeled ticks
- Line plot with markers
- **Footer**: No additional text or elements
## 8. **Additional Notes**
- **Language**: All text is in English.
- **Data Completeness**: No missing labels or axis markers.
- **Chart Type**: Line graph (no heatmap, diagram, or table present).
## 9. **Extracted Data Table (Reconstructed)**
| LLM Size (B) | Validation Loss |
|--------------|-----------------|
| 05 | 1.05 |
| 2 | 0.80 |
| 7 | 0.65 |
## 10. **Conclusion**
The chart illustrates a clear inverse relationship between LLM size (in billions of parameters) and validation loss, with the visual encoder size fixed at 600M. Validation loss decreases from 1.05 at 0.5B to 0.65 at 7B.