# Technical Document Extraction: Prediction Accuracy Over Relative Walltime
## Chart Description
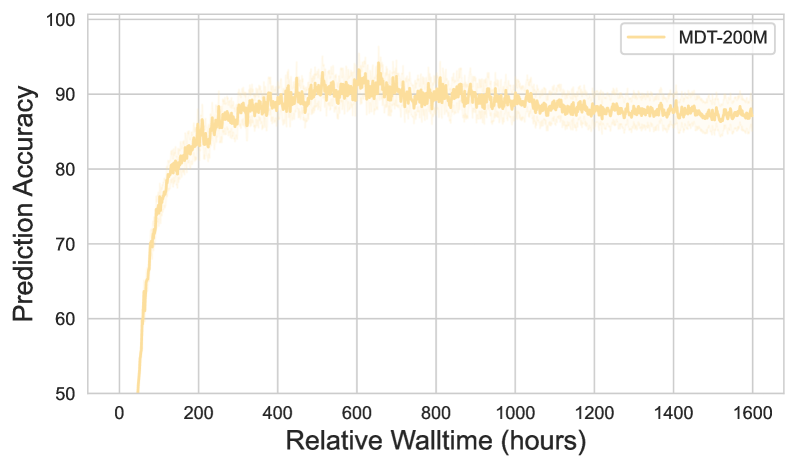
The image depicts a line graph illustrating the relationship between **Prediction Accuracy** and **Relative Walltime (hours)** for a model labeled **MDT-200M**. The graph includes a shaded region around the line to indicate variability in the data.
---
### Key Components
1. **Title**:
- **Prediction Accuracy** (y-axis label)
- **Relative Walltime (hours)** (x-axis label)
2. **Legend**:
- **MDT-200M** (orange line)
- Legend positioned in the **top-right corner** of the chart.
3. **Axes**:
- **X-axis (Relative Walltime)**:
- Range: 0 to 1600 hours.
- Markers at intervals of 200 hours (0, 200, 400, ..., 1600).
- **Y-axis (Prediction Accuracy)**:
- Range: 50% to 100%.
- Markers at intervals of 10% (50, 60, ..., 100).
---
### Data Trends
1. **Line Behavior (MDT-200M)**:
- **Initial Phase (0–200 hours)**:
- The line starts at approximately **60% accuracy** at 0 hours.
- Exhibits a **sharp upward slope**, reaching ~90% accuracy by 200 hours.
- **Stabilization Phase (200–1600 hours)**:
- The line plateaus around **90% accuracy**, with minor fluctuations (e.g., dips to ~89% and peaks to ~91%).
- The shaded region indicates variability, but the central trend remains stable.
2. **Visual Confirmation**:
- The line’s color (orange) matches the legend label **MDT-200M**.
- No other data series or categories are present in the chart.
---
### Observations
- **Accuracy Growth**:
- Rapid improvement in prediction accuracy occurs within the first 200 hours of walltime.
- **Plateau Effect**:
- After 200 hours, accuracy stabilizes near 90%, suggesting diminishing returns in performance gains with additional walltime.
- **Variability**:
- The shaded region around the line indicates minor fluctuations in accuracy, but these do not significantly deviate from the central trend.
---
### Conclusion
The graph demonstrates that the **MDT-200M** model achieves high prediction accuracy (~90%) relatively quickly (within 200 hours) and maintains this performance over extended walltimes (up to 1600 hours). The shaded variability suggests minor instability in the model’s predictions, but the overall trend is consistent.