## Line Chart: f vs. α
### Overview
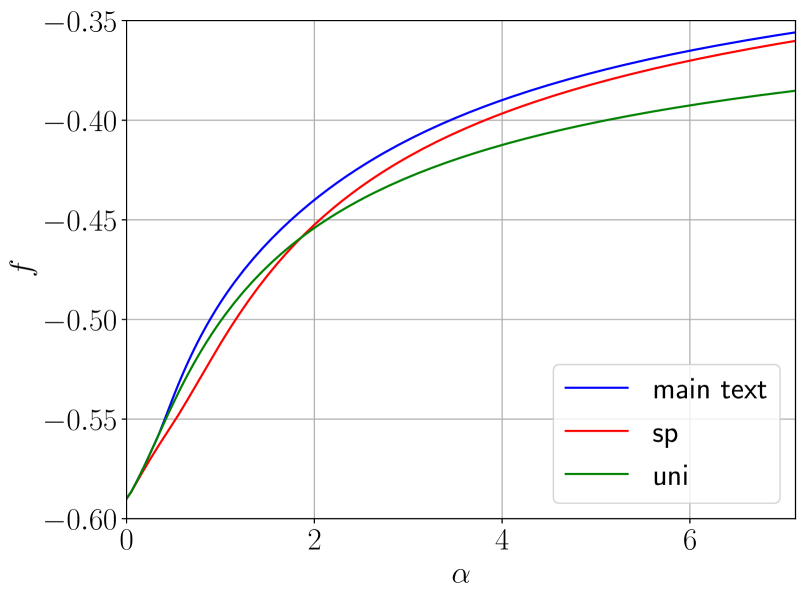
The image is a line chart displaying the relationship between 'f' (y-axis) and 'α' (x-axis) for three different data series: "main text", "sp", and "uni". All three lines start at approximately the same point and increase, but at different rates, as α increases.
### Components/Axes
* **X-axis:** Labeled "α", with numerical values ranging from 0 to 6, incrementing by 2.
* **Y-axis:** Labeled "f", with numerical values ranging from -0.60 to -0.35, incrementing by 0.05.
* **Gridlines:** Present on the chart, aiding in value estimation.
* **Legend:** Located in the bottom-right corner, identifying the three data series:
* "main text" (blue line)
* "sp" (red line)
* "uni" (green line)
### Detailed Analysis
* **"main text" (blue line):** Starts at approximately -0.59 at α = 0 and increases to approximately -0.37 at α = 6. The slope decreases as α increases.
* **"sp" (red line):** Starts at approximately -0.59 at α = 0 and increases to approximately -0.38 at α = 6. The slope decreases as α increases.
* **"uni" (green line):** Starts at approximately -0.59 at α = 0 and increases to approximately -0.43 at α = 6. The slope decreases as α increases.
**Specific Data Points (Approximate):**
| α | main text (blue) | sp (red) | uni (green) |
|------|--------------------|----------|-------------|
| 0 | -0.59 | -0.59 | -0.59 |
| 2 | -0.45 | -0.47 | -0.48 |
| 4 | -0.39 | -0.41 | -0.41 |
| 6 | -0.37 | -0.38 | -0.43 |
### Key Observations
* All three lines start at roughly the same y-value when α is 0.
* The "main text" line consistently has the highest y-value for any given α > 0.
* The "uni" line consistently has the lowest y-value for any given α > 0.
* The rate of increase for all three lines decreases as α increases.
### Interpretation
The chart illustrates how the value of 'f' changes with respect to 'α' for three different conditions or models represented by "main text", "sp", and "uni". The fact that all lines start at the same point suggests a common initial condition. The different slopes and final values indicate that the parameter 'α' has a varying impact on 'f' depending on the specific condition. The "main text" condition appears to be most sensitive to changes in 'α', resulting in the highest 'f' values. The "uni" condition is the least sensitive. The decreasing slope of all lines suggests a diminishing return as 'α' increases.