## Line Graph: Function f vs. Parameter α
### Overview
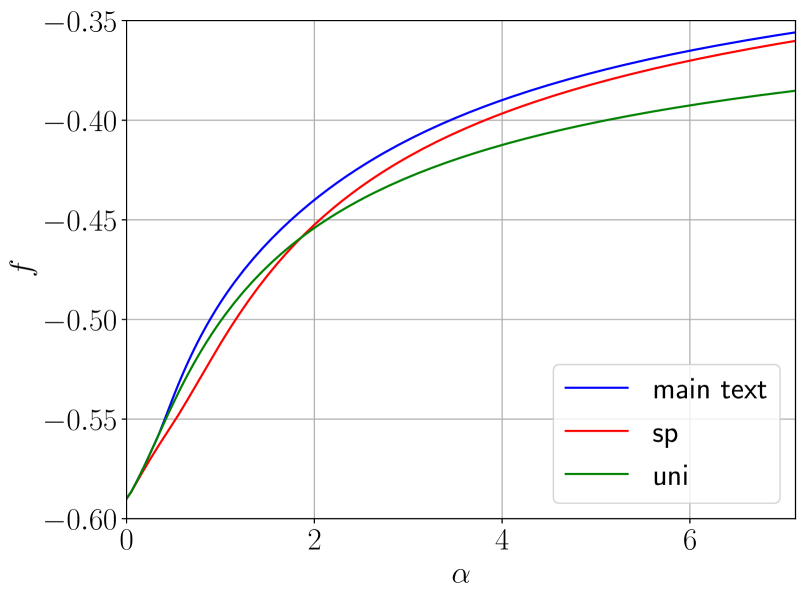
The image depicts a line graph comparing three data series labeled "main text," "sp," and "uni" across a parameter α (x-axis) and a function value f (y-axis). All lines originate at (0, -0.60) and exhibit upward curvature, diverging as α increases. The graph uses a Cartesian coordinate system with gridlines for reference.
### Components/Axes
- **X-axis (α)**: Labeled "α," ranging from 0 to 6 in increments of 2.
- **Y-axis (f)**: Labeled "f," ranging from -0.60 to -0.35 in increments of 0.05.
- **Legend**: Positioned in the bottom-right corner, associating:
- **Blue line**: "main text"
- **Red line**: "sp"
- **Green line**: "uni"
### Detailed Analysis
1. **Line Trends**:
- **Blue ("main text")**: Steepest slope, consistently above other lines. At α=2, f ≈ -0.45; α=4, f ≈ -0.40; α=6, f ≈ -0.35.
- **Red ("sp")**: Intermediate slope, slightly below blue. At α=2, f ≈ -0.47; α=4, f ≈ -0.42; α=6, f ≈ -0.37.
- **Green ("uni")**: Shallowest slope, lowest values. At α=2, f ≈ -0.49; α=4, f ≈ -0.44; α=6, f ≈ -0.40.
2. **Divergence**:
- At α=0, all lines converge at (0, -0.60).
- By α=2, separation begins: blue > red > green.
- By α=6, the gap widens: blue (~-0.35) vs. green (~-0.40), a difference of ~0.05.
### Key Observations
- All lines exhibit concave-up curvature, suggesting accelerating improvement in f with increasing α.
- "main text" outperforms "sp" and "uni" across all α values.
- The divergence between lines grows nonlinearly, indicating accelerating differences in performance.
### Interpretation
The graph likely represents a comparison of three models, algorithms, or parameters (α) influencing a metric f (e.g., efficiency, error rate, or cost). The "main text" series demonstrates superior performance, while "uni" lags behind. The divergence suggests that α has a compounding effect on the relative effectiveness of these models. The y-axis values (negative) imply f could represent a loss function, error metric, or inverted efficiency score. The lack of error bars or confidence intervals limits certainty in exact values, but the trends are visually robust.