TECHNICAL ASSET FINGERPRINT
b0dc1015b0e3d0f937a8fd22
Click to view fullscreen
Press ESC or click to close
FOUND IN PAPERS
EXPERT: gemini-2.0-flash VERSION 1
RUNTIME: nugit/gemini/gemini-2.0-flash
INTEL_VERIFIED
## Line Chart: Mistral-7B Model Performance Comparison
### Overview
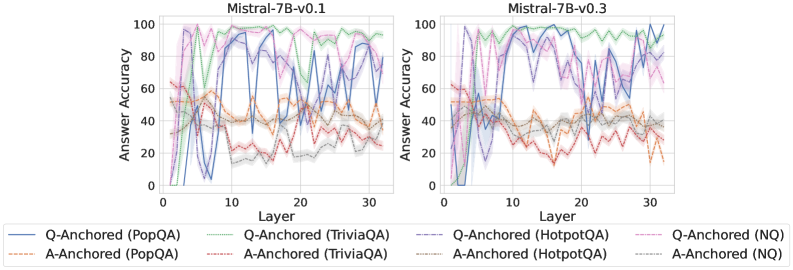
The image presents two line charts comparing the performance of Mistral-7B models (v0.1 and v0.3) across different layers. The charts depict the "Answer Accuracy" on the y-axis versus "Layer" on the x-axis for various question-answering datasets. Each dataset is represented by two lines: one for "Q-Anchored" (question-anchored) and one for "A-Anchored" (answer-anchored) approaches.
### Components/Axes
* **Titles:**
* Left Chart: "Mistral-7B-v0.1"
* Right Chart: "Mistral-7B-v0.3"
* **Y-Axis:** "Answer Accuracy", ranging from 0 to 100. Increments of 20.
* **X-Axis:** "Layer", ranging from 0 to 30. Increments of 10.
* **Legend:** Located at the bottom of the image, describing the lines:
* Blue solid line: "Q-Anchored (PopQA)"
* Brown dashed line: "A-Anchored (PopQA)"
* Green dotted line: "Q-Anchored (TriviaQA)"
* Red dashed-dotted line: "A-Anchored (TriviaQA)"
* Purple dashed line: "Q-Anchored (HotpotQA)"
* Orange dotted line: "A-Anchored (HotpotQA)"
* Pink dashed-dotted line: "Q-Anchored (NQ)"
* Gray dotted line: "A-Anchored (NQ)"
### Detailed Analysis
**Left Chart: Mistral-7B-v0.1**
* **Q-Anchored (PopQA) (Blue solid line):** Starts at approximately 0% accuracy, rises sharply to around 90% by layer 10, fluctuates between 80% and 100% until layer 30.
* Specific points: (0, ~0), (10, ~90), (30, ~90)
* **A-Anchored (PopQA) (Brown dashed line):** Starts around 50%, decreases to 30% by layer 5, then gradually increases to around 40% and remains relatively stable with fluctuations.
* Specific points: (0, ~50), (5, ~30), (30, ~40)
* **Q-Anchored (TriviaQA) (Green dotted line):** Starts around 60%, fluctuates between 80% and 100% throughout all layers.
* Specific points: (0, ~60), (10, ~90), (30, ~90)
* **A-Anchored (TriviaQA) (Red dashed-dotted line):** Starts around 50%, decreases to 20% by layer 10, then remains relatively stable with fluctuations.
* Specific points: (0, ~50), (10, ~20), (30, ~20)
* **Q-Anchored (HotpotQA) (Purple dashed line):** Starts around 60%, fluctuates between 80% and 100% throughout all layers.
* Specific points: (0, ~60), (10, ~90), (30, ~90)
* **A-Anchored (HotpotQA) (Orange dotted line):** Starts around 50%, decreases to 40% by layer 5, then remains relatively stable with fluctuations.
* Specific points: (0, ~50), (5, ~40), (30, ~40)
* **Q-Anchored (NQ) (Pink dashed-dotted line):** Starts around 60%, fluctuates between 80% and 100% throughout all layers.
* Specific points: (0, ~60), (10, ~90), (30, ~90)
* **A-Anchored (NQ) (Gray dotted line):** Starts around 50%, decreases to 20% by layer 10, then remains relatively stable with fluctuations.
* Specific points: (0, ~50), (10, ~20), (30, ~20)
**Right Chart: Mistral-7B-v0.3**
* **Q-Anchored (PopQA) (Blue solid line):** Starts at approximately 0% accuracy, rises sharply to around 90% by layer 10, fluctuates between 70% and 100% until layer 30.
* Specific points: (0, ~0), (10, ~90), (30, ~80)
* **A-Anchored (PopQA) (Brown dashed line):** Starts around 50%, decreases to 30% by layer 5, then gradually increases to around 40% and remains relatively stable with fluctuations.
* Specific points: (0, ~50), (5, ~30), (30, ~40)
* **Q-Anchored (TriviaQA) (Green dotted line):** Starts around 60%, fluctuates between 80% and 100% throughout all layers.
* Specific points: (0, ~60), (10, ~90), (30, ~90)
* **A-Anchored (TriviaQA) (Red dashed-dotted line):** Starts around 50%, decreases to 20% by layer 10, then remains relatively stable with fluctuations.
* Specific points: (0, ~50), (10, ~20), (30, ~20)
* **Q-Anchored (HotpotQA) (Purple dashed line):** Starts around 60%, fluctuates between 80% and 100% throughout all layers.
* Specific points: (0, ~60), (10, ~90), (30, ~90)
* **A-Anchored (HotpotQA) (Orange dotted line):** Starts around 50%, decreases to 40% by layer 5, then remains relatively stable with fluctuations.
* Specific points: (0, ~50), (5, ~40), (30, ~40)
* **Q-Anchored (NQ) (Pink dashed-dotted line):** Starts around 60%, fluctuates between 80% and 100% throughout all layers.
* Specific points: (0, ~60), (10, ~90), (30, ~90)
* **A-Anchored (NQ) (Gray dotted line):** Starts around 50%, decreases to 20% by layer 10, then remains relatively stable with fluctuations.
* Specific points: (0, ~50), (10, ~20), (30, ~20)
### Key Observations
* **Q-Anchored vs. A-Anchored:** Q-Anchored approaches generally achieve significantly higher answer accuracy than A-Anchored approaches across all datasets and both model versions.
* **Dataset Performance:** The Q-Anchored methods for TriviaQA, HotpotQA, and NQ datasets consistently achieve high accuracy (80-100%) across all layers. PopQA starts low and increases.
* **Model Version Comparison:** The performance between Mistral-7B-v0.1 and Mistral-7B-v0.3 is very similar across all datasets and anchoring methods.
* **Layer Impact:** For Q-Anchored methods, accuracy tends to stabilize after the initial layers (around layer 10). A-Anchored methods show relatively stable, lower accuracy across all layers.
### Interpretation
The charts demonstrate the performance of Mistral-7B models on various question-answering datasets, highlighting the difference between question-anchored and answer-anchored approaches. The consistently higher accuracy of Q-Anchored methods suggests that focusing on the question context is more effective for these models. The similarity in performance between v0.1 and v0.3 indicates that the model's core capabilities remained consistent between these versions. The stabilization of accuracy after the initial layers suggests that the model learns the relevant information early on and maintains it throughout the subsequent layers. The A-Anchored methods show a consistent, lower accuracy, indicating that relying solely on the answer context is less effective for these models.
DECODING INTELLIGENCE...
EXPERT: nemotron-free VERSION 2
RUNTIME: free/nvidia/nemotron-nano-12b-v2-vl:free
INTEL_VERIFIED
## Line Graph: Answer Accuracy Across Layers for Mistral-7B Models
### Overview
The image contains two side-by-side line graphs comparing answer accuracy across 30 layers of the Mistral-7B model (versions v0.1 and v0.3). Each graph plots answer accuracy (0–100%) against layer numbers (0–30). The data is segmented by QA datasets (PopQA, TriviaQA, HotpotQA, NQ) and anchoring methods (Q-Anchored vs. A-Anchored).
---
### Components/Axes
- **X-axis**: "Layer" (0–30), representing model layers.
- **Y-axis**: "Answer Accuracy" (0–100%), with gridlines at 20, 40, 60, 80, 100.
- **Legends**:
- **Left Chart (v0.1)**:
- Solid blue: Q-Anchored (PopQA)
- Dashed orange: A-Anchored (PopQA)
- Solid green: Q-Anchored (TriviaQA)
- Dashed red: A-Anchored (TriviaQA)
- Solid purple: Q-Anchored (HotpotQA)
- Dashed gray: A-Anchored (HotpotQA)
- Solid pink: Q-Anchored (NQ)
- Dashed black: A-Anchored (NQ)
- **Right Chart (v0.3)**: Same legend as left chart.
---
### Detailed Analysis
#### Left Chart (Mistral-7B-v0.1)
- **Q-Anchored (PopQA)**: Starts at ~80% accuracy, dips to ~40% at layer 10, then fluctuates between 50–70%.
- **A-Anchored (PopQA)**: Begins at ~30%, peaks at ~60% at layer 10, then drops to ~20% by layer 30.
- **Q-Anchored (TriviaQA)**: Starts at ~70%, dips to ~30% at layer 10, then rises to ~60% by layer 30.
- **A-Anchored (TriviaQA)**: Begins at ~20%, peaks at ~50% at layer 10, then declines to ~10% by layer 30.
- **Q-Anchored (HotpotQA)**: Starts at ~75%, dips to ~40% at layer 10, then stabilizes at ~60%.
- **A-Anchored (HotpotQA)**: Begins at ~25%, peaks at ~55% at layer 10, then drops to ~20%.
- **Q-Anchored (NQ)**: Highly erratic, with sharp drops (e.g., ~90% → ~10% at layer 5) and peaks (e.g., ~80% at layer 20).
- **A-Anchored (NQ)**: Smoother than Q-Anchored, with a peak of ~40% at layer 10 and a decline to ~20% by layer 30.
#### Right Chart (Mistral-7B-v0.3)
- **Q-Anchored (PopQA)**: Starts at ~85%, dips to ~45% at layer 10, then fluctuates between 50–75%.
- **A-Anchored (PopQA)**: Begins at ~35%, peaks at ~65% at layer 10, then drops to ~25%.
- **Q-Anchored (TriviaQA)**: Starts at ~75%, dips to ~35% at layer 10, then rises to ~65% by layer 30.
- **A-Anchored (TriviaQA)**: Begins at ~25%, peaks at ~55% at layer 10, then declines to ~15%.
- **Q-Anchored (HotpotQA)**: Starts at ~80%, dips to ~45% at layer 10, then stabilizes at ~70%.
- **A-Anchored (HotpotQA)**: Begins at ~30%, peaks at ~60% at layer 10, then drops to ~25%.
- **Q-Anchored (NQ)**: Similar erratic pattern to v0.1, with a sharp drop to ~10% at layer 5 and a peak of ~85% at layer 20.
- **A-Anchored (NQ)**: Smoother than Q-Anchored, with a peak of ~45% at layer 10 and a decline to ~25%.
---
### Key Observations
1. **Q-Anchored vs. A-Anchored**:
- Q-Anchored methods generally show higher peak accuracy but greater volatility (e.g., NQ dataset drops from ~90% to ~10% in v0.1).
- A-Anchored methods are more stable but consistently lower in accuracy (e.g., A-Anchored (PopQA) peaks at ~60% vs. Q-Anchored’s ~80%).
2. **Model Version Differences**:
- v0.3 shows slightly higher baseline accuracy for Q-Anchored methods (e.g., PopQA starts at ~85% vs. v0.1’s ~80%).
- A-Anchored methods in v0.3 have marginally higher peaks (e.g., A-Anchored (PopQA) peaks at ~65% vs. v0.1’s ~60%).
3. **NQ Dataset Anomalies**:
- Q-Anchored (NQ) exhibits extreme fluctuations, suggesting instability in handling this dataset.
- A-Anchored (NQ) is less volatile but still underperforms compared to other datasets.
---
### Interpretation
The data suggests that **Q-Anchored methods** (e.g., PopQA, TriviaQA) achieve higher accuracy in specific layers but are prone to instability, particularly with the NQ dataset. **A-Anchored methods** offer more consistent performance but lower overall accuracy. The slight improvements in v0.3 (e.g., higher baseline accuracy for Q-Anchored) indicate minor optimizations in the model architecture. The NQ dataset’s erratic behavior highlights challenges in generalizing across diverse QA tasks.
**Notable Trends**:
- Peaks in accuracy for Q-Anchored methods often occur around layer 10, suggesting early layers are critical for certain tasks.
- A-Anchored methods show a "peak-and-decline" pattern, possibly due to overfitting or layer-specific limitations.
This analysis underscores the trade-off between accuracy and stability in model design, with anchoring methods playing a pivotal role in performance.
DECODING INTELLIGENCE...