\n
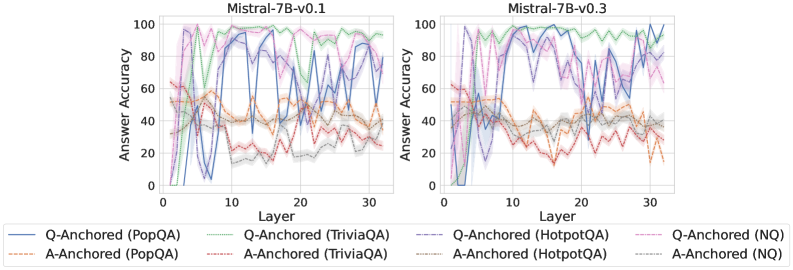
## Line Chart: Answer Accuracy vs. Layer for Mistral Models
### Overview
This image presents two line charts side-by-side, comparing the answer accuracy of the Mistral-7B-v0.1 and Mistral-7B-v0.3 models across different layers. The x-axis represents the layer number (from 0 to 30), and the y-axis represents the answer accuracy (from 0 to 100). Each chart displays multiple lines, each representing a different question-answering dataset and anchoring method.
### Components/Axes
* **X-axis:** Layer (0 to 30, with increments of approximately 2-3)
* **Y-axis:** Answer Accuracy (0 to 100, with increments of 10)
* **Left Chart Title:** Mistral-7B-v0.1
* **Right Chart Title:** Mistral-7B-v0.3
* **Legend (Bottom):**
* Blue Solid Line: Q-Anchored (PopQA)
* Orange Dotted Line: A-Anchored (PopQA)
* Green Solid Line: Q-Anchored (TriviaQA)
* Red Dotted Line: A-Anchored (TriviaQA)
* Purple Dashed Line: Q-Anchored (HotpotQA)
* Teal Dashed Line: A-Anchored (HotpotQA)
* Gray Solid Line: Q-Anchored (NQ)
* Brown Dotted Line: A-Anchored (NQ)
### Detailed Analysis or Content Details
**Mistral-7B-v0.1 (Left Chart):**
* **Q-Anchored (PopQA) - Blue Solid Line:** Starts at approximately 0% accuracy at layer 0, rises sharply to around 80-90% by layer 5, then fluctuates between 70-95% for the remainder of the layers.
* **A-Anchored (PopQA) - Orange Dotted Line:** Starts at approximately 0% accuracy at layer 0, rises to around 40-50% by layer 5, and remains relatively stable between 30-60% for the rest of the layers.
* **Q-Anchored (TriviaQA) - Green Solid Line:** Starts at approximately 0% accuracy at layer 0, rises to around 80-90% by layer 5, and fluctuates between 70-95% for the remainder of the layers.
* **A-Anchored (TriviaQA) - Red Dotted Line:** Starts at approximately 0% accuracy at layer 0, rises to around 40-50% by layer 5, and remains relatively stable between 30-60% for the rest of the layers.
* **Q-Anchored (HotpotQA) - Purple Dashed Line:** Starts at approximately 0% accuracy at layer 0, rises to around 80-90% by layer 5, and fluctuates between 70-95% for the remainder of the layers.
* **A-Anchored (HotpotQA) - Teal Dashed Line:** Starts at approximately 0% accuracy at layer 0, rises to around 40-50% by layer 5, and remains relatively stable between 30-60% for the rest of the layers.
* **Q-Anchored (NQ) - Gray Solid Line:** Starts at approximately 0% accuracy at layer 0, rises to around 80-90% by layer 5, and fluctuates between 70-95% for the remainder of the layers.
* **A-Anchored (NQ) - Brown Dotted Line:** Starts at approximately 0% accuracy at layer 0, rises to around 40-50% by layer 5, and remains relatively stable between 30-60% for the rest of the layers.
**Mistral-7B-v0.3 (Right Chart):**
* **Q-Anchored (PopQA) - Blue Solid Line:** Starts at approximately 0% accuracy at layer 0, rises sharply to around 80-90% by layer 5, then fluctuates between 70-95% for the remainder of the layers.
* **A-Anchored (PopQA) - Orange Dotted Line:** Starts at approximately 0% accuracy at layer 0, rises to around 40-50% by layer 5, and remains relatively stable between 30-60% for the rest of the layers.
* **Q-Anchored (TriviaQA) - Green Solid Line:** Starts at approximately 0% accuracy at layer 0, rises to around 80-90% by layer 5, and fluctuates between 70-95% for the remainder of the layers.
* **A-Anchored (TriviaQA) - Red Dotted Line:** Starts at approximately 0% accuracy at layer 0, rises to around 40-50% by layer 5, and remains relatively stable between 30-60% for the rest of the layers.
* **Q-Anchored (HotpotQA) - Purple Dashed Line:** Starts at approximately 0% accuracy at layer 0, rises to around 80-90% by layer 5, and fluctuates between 70-95% for the remainder of the layers.
* **A-Anchored (HotpotQA) - Teal Dashed Line:** Starts at approximately 0% accuracy at layer 0, rises to around 40-50% by layer 5, and remains relatively stable between 30-60% for the rest of the layers.
* **Q-Anchored (NQ) - Gray Solid Line:** Starts at approximately 0% accuracy at layer 0, rises to around 80-90% by layer 5, and fluctuates between 70-95% for the remainder of the layers.
* **A-Anchored (NQ) - Brown Dotted Line:** Starts at approximately 0% accuracy at layer 0, rises to around 40-50% by layer 5, and remains relatively stable between 30-60% for the rest of the layers.
### Key Observations
* The Q-Anchored lines consistently achieve significantly higher accuracy than the A-Anchored lines across all datasets and for both models.
* Accuracy generally increases rapidly in the initial layers (0-5) and then plateaus with some fluctuations.
* The two models (v0.1 and v0.3) exhibit very similar performance patterns.
* The accuracy ranges for the Q-Anchored lines are similar across different datasets (PopQA, TriviaQA, HotpotQA, NQ).
* The accuracy ranges for the A-Anchored lines are similar across different datasets (PopQA, TriviaQA, HotpotQA, NQ).
### Interpretation
The data suggests that question-anchoring (Q-Anchored) is a more effective method for improving answer accuracy in the Mistral models compared to answer-anchoring (A-Anchored). Both models demonstrate a similar learning curve, with a rapid increase in accuracy in the early layers followed by a stabilization. The consistent performance across different datasets indicates that the observed trends are not specific to any particular question-answering task. The relatively low accuracy of the A-Anchored lines suggests that the models may struggle to effectively utilize answer-based information for improving performance. The fluctuations in accuracy after layer 5 could be due to overfitting or the inherent complexity of the question-answering tasks. The similarity between the two model versions (v0.1 and v0.3) suggests that the core architecture and training data are similar, and the improvements in v0.3 may not be substantial in terms of the overall accuracy trend.