TECHNICAL ASSET FINGERPRINT
b0dc1015b0e3d0f937a8fd22
Click to view fullscreen
Press ESC or click to close
FOUND IN PAPERS
EXPERT: healer-alpha-free VERSION 1
RUNTIME: free/openrouter/healer-alpha
INTEL_VERIFIED
## Line Charts: Mistral-7B Model Layer-wise Answer Accuracy
### Overview
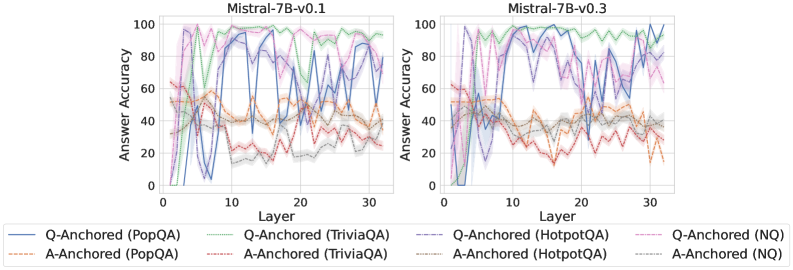
The image displays two side-by-side line charts comparing the "Answer Accuracy" across model layers (0-30) for two versions of the Mistral-7B model: v0.1 (left) and v0.3 (right). Each chart plots the performance of eight different evaluation setups, defined by a combination of an anchoring method (Q-Anchored or A-Anchored) and a dataset (PopQA, TriviaQA, HotpotQA, NQ).
### Components/Axes
* **Titles:**
* Left Chart: `Mistral-7B-v0.1`
* Right Chart: `Mistral-7B-v0.3`
* **X-Axis (Both Charts):** Label: `Layer`. Scale: Linear, from 0 to 30, with major ticks at 0, 10, 20, 30.
* **Y-Axis (Both Charts):** Label: `Answer Accuracy`. Scale: Linear, from 0 to 100, with major ticks at 0, 20, 40, 60, 80, 100.
* **Legend (Bottom, spanning both charts):** Contains 8 entries, each with a specific color and line style:
1. `Q-Anchored (PopQA)`: Solid blue line.
2. `Q-Anchored (TriviaQA)`: Solid green line.
3. `Q-Anchored (HotpotQA)`: Dashed purple line.
4. `Q-Anchored (NQ)`: Dotted pink line.
5. `A-Anchored (PopQA)`: Dashed orange line.
6. `A-Anchored (TriviaQA)`: Dotted red line.
7. `A-Anchored (HotpotQA)`: Dash-dot gray line.
8. `A-Anchored (NQ)`: Dash-dot-dot light blue line.
* **Plot Elements:** Each data series is represented by a colored line with a semi-transparent shaded band around it, likely indicating variance or confidence intervals.
### Detailed Analysis
**Mistral-7B-v0.1 (Left Chart):**
* **Q-Anchored Series (Generally Higher Accuracy):**
* `Q-Anchored (TriviaQA)` (Solid Green): Shows a strong upward trend from layer 0, peaks near 100% accuracy between layers ~10-20, then gradually declines but remains above 80% at layer 30.
* `Q-Anchored (HotpotQA)` (Dashed Purple): Follows a similar but slightly lower trajectory than TriviaQA, peaking near 100% around layer 15 and ending near 80%.
* `Q-Anchored (PopQA)` (Solid Blue): Highly volatile. Starts low, spikes to ~90% near layer 5, drops sharply, then oscillates with high amplitude between ~20% and 90% across the remaining layers.
* `Q-Anchored (NQ)` (Dotted Pink): Rises to a peak of ~95% around layer 10, then declines steadily to about 60% by layer 30.
* **A-Anchored Series (Generally Lower, More Volatile Accuracy):**
* All four A-Anchored lines (`PopQA`-orange, `TriviaQA`-red, `HotpotQA`-gray, `NQ`-light blue) cluster in the lower half of the chart (mostly between 20% and 60%).
* They exhibit significant volatility and overlap, with no single dataset clearly dominating. Their trends are less defined, often dipping below 20% at various layers.
**Mistral-7B-v0.3 (Right Chart):**
* **Q-Anchored Series:**
* `Q-Anchored (TriviaQA)` (Solid Green): Maintains very high accuracy (>90%) across almost all layers from 5 to 30, showing more stability than in v0.1.
* `Q-Anchored (HotpotQA)` (Dashed Purple): Also shows improved stability, staying mostly above 80% after layer 5, with a dip around layer 20.
* `Q-Anchored (PopQA)` (Solid Blue): Remains highly volatile, with sharp peaks and troughs across the entire layer range, similar to v0.1.
* `Q-Anchored (NQ)` (Dotted Pink): Peaks early (~95% at layer 5) and then shows a more pronounced decline compared to v0.1, falling to around 50% by layer 30.
* **A-Anchored Series:**
* The cluster of A-Anchored lines remains in the lower accuracy band (20%-60%).
* They appear slightly more separated than in v0.1, with `A-Anchored (PopQA)` (orange) and `A-Anchored (TriviaQA)` (red) showing somewhat more distinct, though still volatile, paths.
### Key Observations
1. **Anchoring Method Dominance:** The most striking pattern is the clear performance gap between Q-Anchored and A-Anchored methods. Q-Anchored approaches consistently achieve higher answer accuracy across both model versions and most datasets.
2. **Dataset Sensitivity:** Performance is highly dataset-dependent. `TriviaQA` and `HotpotQA` under Q-Anchoring show the most robust and high accuracy, especially in later layers of v0.3. `PopQA` under Q-Anchoring is uniquely unstable.
3. **Model Version Evolution (v0.1 to v0.3):** The transition from v0.1 to v0.3 appears to stabilize and improve the performance of the top-performing Q-Anchored series (`TriviaQA`, `HotpotQA`), particularly in the middle-to-late layers (10-30). The volatile `Q-Anchored (PopQA)` and declining `Q-Anchored (NQ)` patterns persist.
4. **Layer-wise Trends:** Accuracy is not monotonic with layer depth. For high-performing series, accuracy often peaks in the middle layers (5-20) before plateauing or declining. Early layers (0-5) generally show lower accuracy.
### Interpretation
This data suggests that the **choice of anchoring method (Q vs. A) is a more critical factor for performance than the specific model version (v0.1 vs. v0.3)** for these tasks. Q-Anchoring, which likely conditions the model on the question, provides a much stronger signal for retrieving accurate answers than A-Anchoring (conditioning on the answer), which leads to noisy and poor performance.
The **improvement from v0.1 to v0.3** indicates targeted refinement. The model's internal representations for factual recall (as measured by TriviaQA and HotpotQA) have become more robust and consistent across its depth, suggesting better knowledge consolidation or more effective information flow in the later version.
The **extreme volatility of `Q-Anchored (PopQA)`** is a notable anomaly. It implies that for this specific dataset, the model's ability to produce accurate answers is highly sensitive to the specific layer being probed, possibly due to the nature of the questions or answers in PopQA interfering with the model's processing pathway.
The **declining trend for `Q-Anchored (NQ)`** in both versions, but more sharply in v0.3, is curious. It might indicate that for Natural Questions, the most relevant information is encoded in middle layers, and deeper layers may be over-specializing or drifting away from this specific type of factual recall.
In summary, the charts reveal that optimal performance is achieved by **combining Q-Anchoring with datasets like TriviaQA or HotpotQA and utilizing the model's middle-to-late layers**, with the newer model version offering more stability. The results highlight the importance of both the evaluation methodology (anchoring) and the model's internal layer-wise organization for factual accuracy.
DECODING INTELLIGENCE...