## Line Graph: Answer Accuracy Across Layers for Mistral-7B Models
### Overview
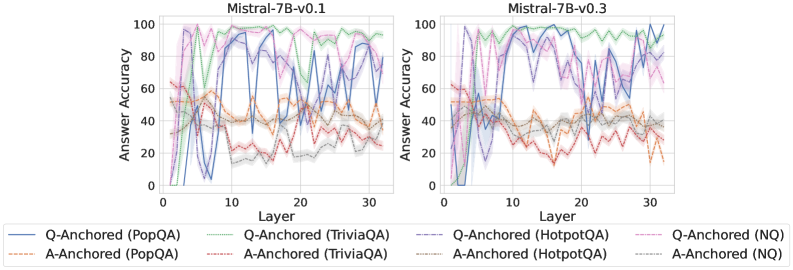
The image contains two side-by-side line graphs comparing answer accuracy across 30 layers of the Mistral-7B model (versions v0.1 and v0.3). Each graph plots answer accuracy (0–100%) against layer numbers (0–30). The data is segmented by QA datasets (PopQA, TriviaQA, HotpotQA, NQ) and anchoring methods (Q-Anchored vs. A-Anchored).
---
### Components/Axes
- **X-axis**: "Layer" (0–30), representing model layers.
- **Y-axis**: "Answer Accuracy" (0–100%), with gridlines at 20, 40, 60, 80, 100.
- **Legends**:
- **Left Chart (v0.1)**:
- Solid blue: Q-Anchored (PopQA)
- Dashed orange: A-Anchored (PopQA)
- Solid green: Q-Anchored (TriviaQA)
- Dashed red: A-Anchored (TriviaQA)
- Solid purple: Q-Anchored (HotpotQA)
- Dashed gray: A-Anchored (HotpotQA)
- Solid pink: Q-Anchored (NQ)
- Dashed black: A-Anchored (NQ)
- **Right Chart (v0.3)**: Same legend as left chart.
---
### Detailed Analysis
#### Left Chart (Mistral-7B-v0.1)
- **Q-Anchored (PopQA)**: Starts at ~80% accuracy, dips to ~40% at layer 10, then fluctuates between 50–70%.
- **A-Anchored (PopQA)**: Begins at ~30%, peaks at ~60% at layer 10, then drops to ~20% by layer 30.
- **Q-Anchored (TriviaQA)**: Starts at ~70%, dips to ~30% at layer 10, then rises to ~60% by layer 30.
- **A-Anchored (TriviaQA)**: Begins at ~20%, peaks at ~50% at layer 10, then declines to ~10% by layer 30.
- **Q-Anchored (HotpotQA)**: Starts at ~75%, dips to ~40% at layer 10, then stabilizes at ~60%.
- **A-Anchored (HotpotQA)**: Begins at ~25%, peaks at ~55% at layer 10, then drops to ~20%.
- **Q-Anchored (NQ)**: Highly erratic, with sharp drops (e.g., ~90% → ~10% at layer 5) and peaks (e.g., ~80% at layer 20).
- **A-Anchored (NQ)**: Smoother than Q-Anchored, with a peak of ~40% at layer 10 and a decline to ~20% by layer 30.
#### Right Chart (Mistral-7B-v0.3)
- **Q-Anchored (PopQA)**: Starts at ~85%, dips to ~45% at layer 10, then fluctuates between 50–75%.
- **A-Anchored (PopQA)**: Begins at ~35%, peaks at ~65% at layer 10, then drops to ~25%.
- **Q-Anchored (TriviaQA)**: Starts at ~75%, dips to ~35% at layer 10, then rises to ~65% by layer 30.
- **A-Anchored (TriviaQA)**: Begins at ~25%, peaks at ~55% at layer 10, then declines to ~15%.
- **Q-Anchored (HotpotQA)**: Starts at ~80%, dips to ~45% at layer 10, then stabilizes at ~70%.
- **A-Anchored (HotpotQA)**: Begins at ~30%, peaks at ~60% at layer 10, then drops to ~25%.
- **Q-Anchored (NQ)**: Similar erratic pattern to v0.1, with a sharp drop to ~10% at layer 5 and a peak of ~85% at layer 20.
- **A-Anchored (NQ)**: Smoother than Q-Anchored, with a peak of ~45% at layer 10 and a decline to ~25%.
---
### Key Observations
1. **Q-Anchored vs. A-Anchored**:
- Q-Anchored methods generally show higher peak accuracy but greater volatility (e.g., NQ dataset drops from ~90% to ~10% in v0.1).
- A-Anchored methods are more stable but consistently lower in accuracy (e.g., A-Anchored (PopQA) peaks at ~60% vs. Q-Anchored’s ~80%).
2. **Model Version Differences**:
- v0.3 shows slightly higher baseline accuracy for Q-Anchored methods (e.g., PopQA starts at ~85% vs. v0.1’s ~80%).
- A-Anchored methods in v0.3 have marginally higher peaks (e.g., A-Anchored (PopQA) peaks at ~65% vs. v0.1’s ~60%).
3. **NQ Dataset Anomalies**:
- Q-Anchored (NQ) exhibits extreme fluctuations, suggesting instability in handling this dataset.
- A-Anchored (NQ) is less volatile but still underperforms compared to other datasets.
---
### Interpretation
The data suggests that **Q-Anchored methods** (e.g., PopQA, TriviaQA) achieve higher accuracy in specific layers but are prone to instability, particularly with the NQ dataset. **A-Anchored methods** offer more consistent performance but lower overall accuracy. The slight improvements in v0.3 (e.g., higher baseline accuracy for Q-Anchored) indicate minor optimizations in the model architecture. The NQ dataset’s erratic behavior highlights challenges in generalizing across diverse QA tasks.
**Notable Trends**:
- Peaks in accuracy for Q-Anchored methods often occur around layer 10, suggesting early layers are critical for certain tasks.
- A-Anchored methods show a "peak-and-decline" pattern, possibly due to overfitting or layer-specific limitations.
This analysis underscores the trade-off between accuracy and stability in model design, with anchoring methods playing a pivotal role in performance.