## Scatter Plot: Energy vs. Number of Satisfied Clauses
### Overview
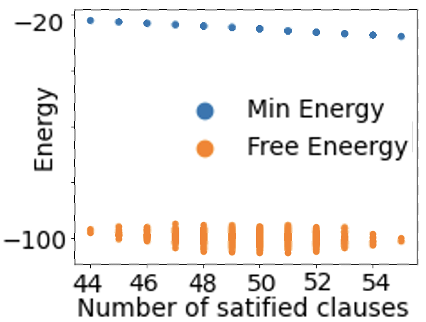
The image is a scatter plot showing the relationship between "Energy" and "Number of satisfied clauses". Two data series are plotted: "Min Energy" and "Free Energy". The plot shows how these energy values change as the number of satisfied clauses increases.
### Components/Axes
* **X-axis:** "Number of satified clauses". The axis ranges from approximately 44 to 54, with tick marks at even intervals (44, 46, 48, 50, 52, 54).
* **Y-axis:** "Energy". The axis ranges from approximately -100 to -20.
* **Legend:** Located in the center-right of the plot.
* Blue circle: "Min Energy"
* Orange circle: "Free Eneergy"
### Detailed Analysis
* **Min Energy (Blue):** The "Min Energy" data points show a slight downward trend as the number of satisfied clauses increases.
* At 44 satisfied clauses, the "Min Energy" is approximately -20.
* At 54 satisfied clauses, the "Min Energy" is approximately -23.
* **Free Energy (Orange):** The "Free Energy" data points are clustered around -100. The data points appear as vertical lines at each x-axis value.
* At 44 satisfied clauses, the "Free Energy" is approximately -98.
* At 54 satisfied clauses, the "Free Energy" is approximately -102.
### Key Observations
* The "Min Energy" values are significantly higher (less negative) than the "Free Energy" values.
* The "Min Energy" decreases slightly as the number of satisfied clauses increases.
* The "Free Energy" remains relatively constant, clustered around -100, regardless of the number of satisfied clauses.
### Interpretation
The plot suggests that as the number of satisfied clauses increases, the minimum energy of the system decreases slightly. However, the free energy remains relatively stable. This could indicate that while the system can find slightly lower energy states with more satisfied clauses, the overall free energy landscape is not significantly affected. The clustering of "Free Energy" values suggests a strong constraint or a stable equilibrium point.