\n
## Scatter Plot: Energy vs. Satisfied Clauses
### Overview
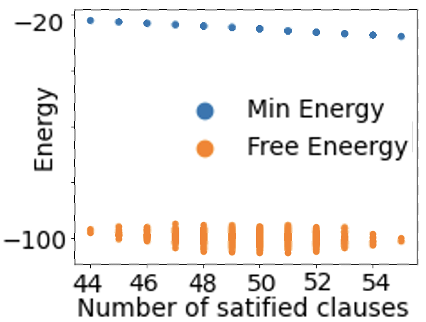
The image presents a scatter plot comparing "Min Energy" and "Free Energy" against the "Number of satisfied clauses". The plot displays two distinct data series as points, showing their relationship with the number of satisfied clauses.
### Components/Axes
* **X-axis:** "Number of satisfied clauses", ranging from approximately 44 to 54, with markers at integer values.
* **Y-axis:** "Energy", ranging from approximately -100 to -20, with markers at integer values.
* **Legend:** Located in the top-right corner.
* Blue circles: "Min Energy"
* Orange circles: "Free Energy"
### Detailed Analysis
**Min Energy (Blue Series):**
The blue data series shows a relatively flat trend. The points are clustered horizontally around the energy level of approximately -18.
* At 44 satisfied clauses: Energy ≈ -18.5
* At 45 satisfied clauses: Energy ≈ -18.5
* At 46 satisfied clauses: Energy ≈ -18.5
* At 47 satisfied clauses: Energy ≈ -18.5
* At 48 satisfied clauses: Energy ≈ -18.5
* At 49 satisfied clauses: Energy ≈ -18.5
* At 50 satisfied clauses: Energy ≈ -18.5
* At 51 satisfied clauses: Energy ≈ -18.5
* At 52 satisfied clauses: Energy ≈ -18.5
* At 53 satisfied clauses: Energy ≈ -18.5
* At 54 satisfied clauses: Energy ≈ -18.5
**Free Energy (Orange Series):**
The orange data series also exhibits a relatively flat trend, but at a much lower energy level. The points are clustered horizontally around the energy level of approximately -98.
* At 44 satisfied clauses: Energy ≈ -98.5
* At 45 satisfied clauses: Energy ≈ -98.5
* At 46 satisfied clauses: Energy ≈ -98.5
* At 47 satisfied clauses: Energy ≈ -98.5
* At 48 satisfied clauses: Energy ≈ -98.5
* At 49 satisfied clauses: Energy ≈ -98.5
* At 50 satisfied clauses: Energy ≈ -98.5
* At 51 satisfied clauses: Energy ≈ -98.5
* At 52 satisfied clauses: Energy ≈ -98.5
* At 53 satisfied clauses: Energy ≈ -98.5
* At 54 satisfied clauses: Energy ≈ -98.5
### Key Observations
* Both data series show minimal variation in energy levels as the number of satisfied clauses increases.
* "Min Energy" consistently has a significantly higher (less negative) energy value than "Free Energy".
* There is no apparent correlation between the number of satisfied clauses and the energy levels for either series.
### Interpretation
The plot suggests that, within the observed range of satisfied clauses (44-54), neither "Min Energy" nor "Free Energy" is significantly affected by the number of clauses satisfied. The large difference in energy levels between the two series indicates that "Free Energy" is a much more sensitive metric, or represents a different aspect of the system being modeled. The lack of correlation could indicate that the system has reached a plateau in terms of energy reduction with increasing clause satisfaction, or that other factors are influencing the energy levels. The consistent flat lines suggest a stable state or a limited range of exploration within the parameters of the simulation or experiment.