\n
## Line Chart: Surprisal vs. Training Steps
### Overview
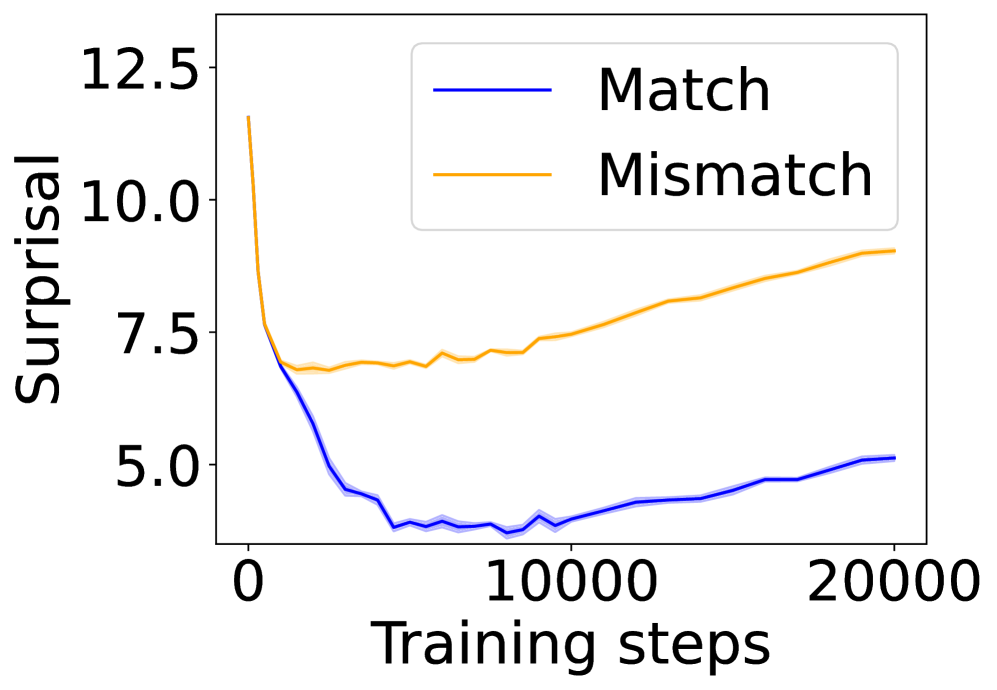
This image presents a line chart illustrating the relationship between "Surprisal" (y-axis) and "Training steps" (x-axis). Two data series are plotted: one representing "Match" and the other "Mismatch". The chart appears to track the surprisal of these two conditions during a training process.
### Components/Axes
* **X-axis:** "Training steps", ranging from approximately 0 to 20000. The axis is linearly scaled.
* **Y-axis:** "Surprisal", ranging from approximately 4.5 to 12.5. The axis is linearly scaled.
* **Legend:** Located in the top-right corner.
* "Match" - represented by a blue line.
* "Mismatch" - represented by an orange line.
### Detailed Analysis
**Match (Blue Line):**
The blue line representing "Match" starts at approximately 6.0 at 0 training steps. It exhibits a steep downward trend initially, reaching a minimum of approximately 4.2 at around 5000 training steps. After this point, the line plateaus and fluctuates between approximately 4.2 and 5.5, with a slight upward trend towards the end of the observed training steps, reaching approximately 5.3 at 20000 steps.
**Mismatch (Orange Line):**
The orange line representing "Mismatch" begins at approximately 7.5 at 0 training steps. It initially decreases to a minimum of approximately 6.8 at around 2000 training steps. Subsequently, the line increases steadily, with some fluctuations, reaching approximately 8.5 at 20000 training steps.
**Data Points (Approximate):**
| Training Steps | Match (Surprisal) | Mismatch (Surprisal) |
|---|---|---|
| 0 | 6.0 | 7.5 |
| 2000 | ~5.0 | 6.8 |
| 5000 | 4.2 | ~7.2 |
| 10000 | ~4.8 | ~7.8 |
| 20000 | 5.3 | 8.5 |
### Key Observations
* The "Match" condition consistently exhibits lower surprisal values than the "Mismatch" condition throughout the training process.
* The surprisal for "Match" decreases rapidly during the initial training phase and then stabilizes.
* The surprisal for "Mismatch" increases steadily throughout the training process.
* The gap between the surprisal values of "Match" and "Mismatch" widens as training progresses.
### Interpretation
The chart suggests that the training process is successfully reducing the surprisal associated with the "Match" condition, indicating that the model is learning to better predict or recognize matching instances. Conversely, the increasing surprisal for the "Mismatch" condition suggests that the model is becoming more sensitive to discrepancies or non-matching instances. The widening gap between the two conditions implies that the model is effectively differentiating between matching and mismatching data points as training progresses. This could indicate successful learning of a discrimination task. The initial rapid decrease in "Match" surprisal suggests a period of fast learning, followed by a refinement phase where the model's performance plateaus. The consistent increase in "Mismatch" surprisal suggests that the model is continually challenged by non-matching data, leading to ongoing adjustments and learning.