# Technical Document Analysis: Performance Speedup Chart
## Chart Overview
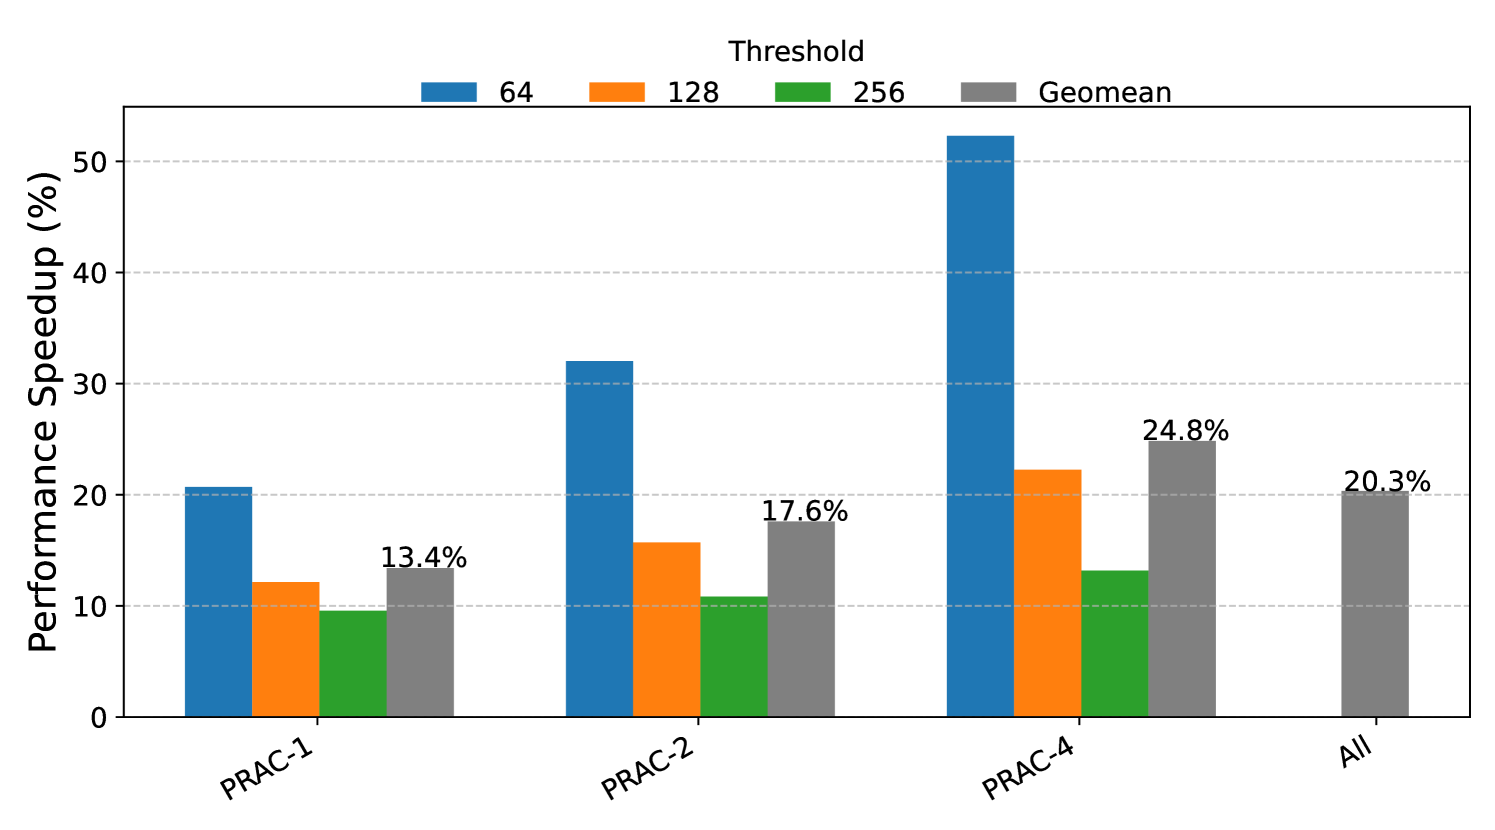
The image is a **grouped bar chart** titled **"Threshold"**, comparing performance speedup percentages across different computational thresholds (64, 128, 256) and a geometric mean (Geomean) across three PRAC categories (PRAC-1, PRAC-2, PRAC-4) and an aggregated "All" category.
---
### **Legend & Color Mapping**
- **Legend Position**: Top of the chart.
- **Color-Coded Thresholds**:
- **Blue**: Threshold = 64
- **Orange**: Threshold = 128
- **Green**: Threshold = 256
- **Gray**: Geomean (geometric mean of thresholds)
- **Verification**: All bar colors strictly align with the legend (e.g., PRAC-1's blue bar = 20.7%, orange = 12.1%, green = 9.5%, gray = 13.4%).
---
### **Axis Labels**
- **X-Axis**: Categories labeled as `PRAC-1`, `PRAC-2`, `PRAC-4`, and `All`.
- **Y-Axis**: Labeled **"Performance Speedup (%)"**, ranging from 0% to 50% in 10% increments.
- **Gridlines**: Dashed horizontal lines at every 10% increment.
---
### **Data Points & Trends**
#### **PRAC-1**
- **Threshold 64 (Blue)**: 20.7%
- **Threshold 128 (Orange)**: 12.1%
- **Threshold 256 (Green)**: 9.5%
- **Geomean (Gray)**: 13.4%
- **Trend**: Speedup decreases as threshold increases. Geomean (13.4%) lies between 12.1% and 9.5%, consistent with geometric mean calculation.
#### **PRAC-2**
- **Threshold 64 (Blue)**: 32.1%
- **Threshold 128 (Orange)**: 15.8%
- **Threshold 256 (Green)**: 10.7%
- **Geomean (Gray)**: 17.6%
- **Trend**: Similar decreasing pattern. Geomean (17.6%) aligns with geometric mean of 32.1%, 15.8%, and 10.7%.
#### **PRAC-4**
- **Threshold 64 (Blue)**: 52.3%
- **Threshold 128 (Orange)**: 22.4%
- **Threshold 256 (Green)**: 13.1%
- **Geomean (Gray)**: 24.8%
- **Trend**: Highest speedup at threshold 64. Geomean (24.8%) reflects geometric mean of 52.3%, 22.4%, and 13.1%.
#### **All**
- **Geomean (Gray)**: 20.3%
- **Trend**: Represents an aggregated geometric mean across all PRAC categories. No bars for thresholds 64, 128, or 256.
---
### **Key Observations**
1. **Threshold Impact**: Higher thresholds (256) consistently yield lower speedups across all PRAC categories.
2. **Geomean Behavior**: The geometric mean (gray bars) provides a normalized performance metric, balancing the effects of varying thresholds.
3. **PRAC-4 Dominance**: PRAC-4 exhibits the highest speedup at threshold 64 (52.3%), suggesting it is optimized for lower thresholds.
4. **Aggregated Data**: The "All" category isolates the Geomean (20.3%), likely representing a system-wide average.
---
### **Structural Notes**
- **Chart Type**: Grouped bar chart with four categories on the x-axis.
- **Data Representation**: Each PRAC category has three bars (thresholds 64, 128, 256) and one Geomean bar. The "All" category only includes the Geomean.
- **Visual Clarity**: Color coding and gridlines enhance readability of performance differences.
---
### **Conclusion**
The chart illustrates how performance speedup varies with computational thresholds across different PRAC configurations. The geometric mean provides a consistent benchmark, while PRAC-4 demonstrates the highest efficiency at lower thresholds. No textual data beyond the legend, axis labels, and embedded percentages is present.