## Bar Chart: Performance Speedup by Threshold
### Overview
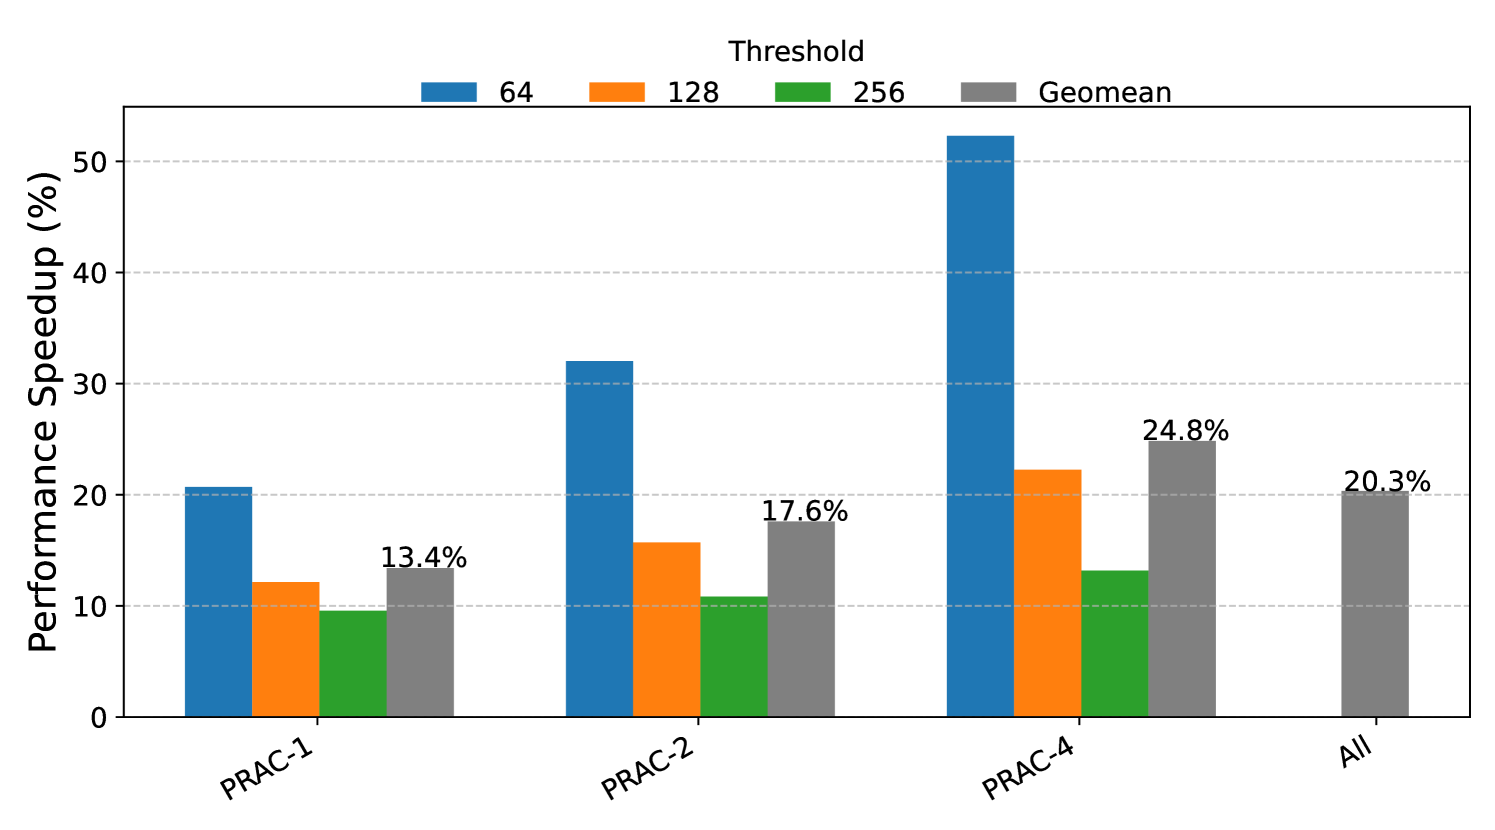
The image is a bar chart comparing the performance speedup (%) for different threshold values (64, 128, 256) and the geometric mean across different configurations (PRAC-1, PRAC-2, PRAC-4, and All).
### Components/Axes
* **Title:** Threshold
* **Y-axis:** Performance Speedup (%)
* Scale: 0% to 50% in increments of 10%.
* **X-axis:** Categories: PRAC-1, PRAC-2, PRAC-4, All
* **Legend:** Located at the top of the chart.
* Blue: 64
* Orange: 128
* Green: 256
* Gray: Geomean
### Detailed Analysis
* **PRAC-1:**
* 64 (Blue): Approximately 21%
* 128 (Orange): Approximately 12%
* 256 (Green): Approximately 9%
* Geomean (Gray): 13.4%
* **PRAC-2:**
* 64 (Blue): Approximately 32%
* 128 (Orange): Approximately 16%
* 256 (Green): Approximately 11%
* Geomean (Gray): 17.6%
* **PRAC-4:**
* 64 (Blue): Approximately 52%
* 128 (Orange): Approximately 22%
* 256 (Green): Approximately 13%
* Geomean (Gray): 24.8%
* **All:**
* Geomean (Gray): 20.3%
### Key Observations
* The '64' threshold (blue bars) consistently yields the highest performance speedup across all PRAC configurations.
* The '256' threshold (green bars) generally results in the lowest performance speedup.
* PRAC-4 shows the most significant performance speedup, especially with the '64' threshold.
* The Geomean performance speedup increases from PRAC-1 to PRAC-4.
### Interpretation
The chart indicates that a threshold value of 64 generally provides the best performance speedup compared to higher threshold values (128 and 256). The performance is also highly dependent on the PRAC configuration, with PRAC-4 showing the most significant gains. The geometric mean provides an overall average performance speedup for each configuration, showing an increasing trend from PRAC-1 to PRAC-4. The "All" category represents the geometric mean across all PRAC configurations.