# Technical Data Extraction: Performance Comparison of Methods
This document provides a comprehensive extraction of data from two side-by-side bar charts comparing the performance of various computational methods across two benchmarks: **HotpotQA** and **LiveCodeBench**.
## 1. General Metadata
* **Y-Axis Label:** Performance (%)
* **X-Axis Label:** Method
* **Visual Indicators:**
* **Base:** Indicated by a grey label above the first bar in each chart.
* **Green Text (+%):** Indicates a performance improvement relative to the base method.
* **Red Text (-%):** Indicates a performance decrease relative to the base method.
* **Language:** English (100%)
---
## 2. Chart 1: HotpotQA
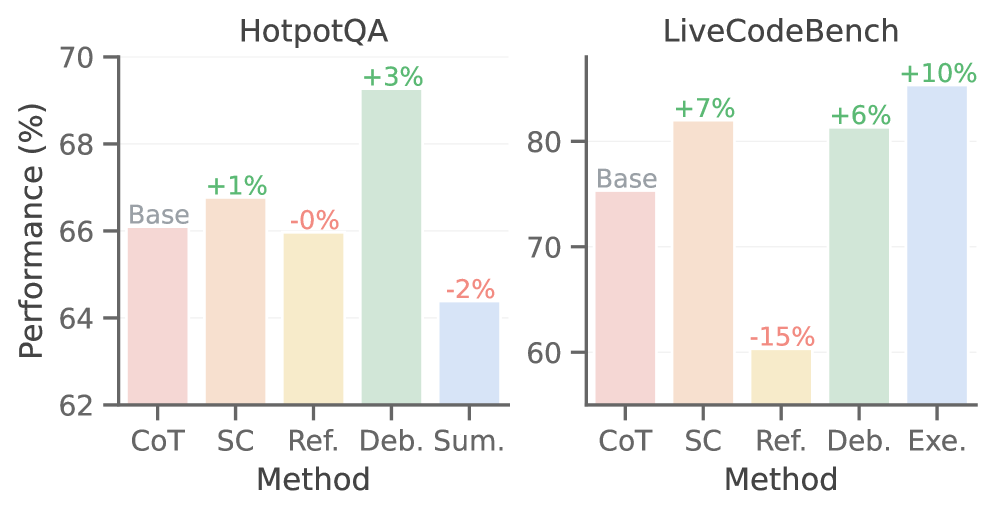
This chart evaluates five methods on the HotpotQA benchmark. The Y-axis ranges from 62% to 70% in increments of 2.
### Data Table (Extracted)
| Method | Color | Label/Delta | Estimated Performance (%) |
| :--- | :--- | :--- | :--- |
| **CoT** | Light Red/Pink | Base | ~66.1% |
| **SC** | Light Orange | +1% | ~66.8% |
| **Ref.** | Light Yellow | -0% | ~65.9% |
| **Deb.** | Light Green | +3% | ~69.2% |
| **Sum.** | Light Blue | -2% | ~64.4% |
### Trend Analysis
* **Baseline:** Chain of Thought (CoT) serves as the baseline at approximately 66%.
* **Peak Performance:** The **Deb.** (Debate) method shows the highest performance, reaching nearly 70%, a 3% improvement over the base.
* **Lowest Performance:** The **Sum.** (Summarization) method shows the lowest performance, dropping below the baseline to approximately 64.4%.
* **Marginal Changes:** **SC** (Self-Consistency) shows a slight gain, while **Ref.** (Reflection/Refinement) shows a negligible decrease labeled as "-0%".
---
## 3. Chart 2: LiveCodeBench
This chart evaluates five methods on the LiveCodeBench benchmark. The Y-axis ranges from 60% to 80%+ in increments of 10.
### Data Table (Extracted)
| Method | Color | Label/Delta | Estimated Performance (%) |
| :--- | :--- | :--- | :--- |
| **CoT** | Light Red/Pink | Base | ~75% |
| **SC** | Light Orange | +7% | ~82% |
| **Ref.** | Light Yellow | -15% | ~60% |
| **Deb.** | Light Green | +6% | ~81% |
| **Exe.** | Light Blue | +10% | ~85% |
### Trend Analysis
* **Baseline:** CoT starts at a 75% performance level.
* **Peak Performance:** The **Exe.** (Execution) method is the top performer, reaching approximately 85% (+10% over base).
* **Significant Outlier:** The **Ref.** method experiences a drastic performance drop of 15%, falling to the 60% floor of the chart.
* **Strong Gains:** Both **SC** and **Deb.** show significant improvements (+7% and +6% respectively), both exceeding the 80% performance mark.
---
## 4. Component Summary & Comparison
* **Method Abbreviations:**
* **CoT:** Chain of Thought
* **SC:** Self-Consistency
* **Ref.:** Reflection / Refinement
* **Deb.:** Debate
* **Sum.:** Summarization (HotpotQA only)
* **Exe.:** Execution (LiveCodeBench only)
* **Cross-Benchmark Observation:** The **Deb.** (Debate) method consistently provides a performance boost in both benchmarks (+3% and +6%). Conversely, the **Ref.** method consistently underperforms the baseline in both scenarios, with a particularly severe degradation in LiveCodeBench.