# Technical Document Extraction: Performance Comparison Charts
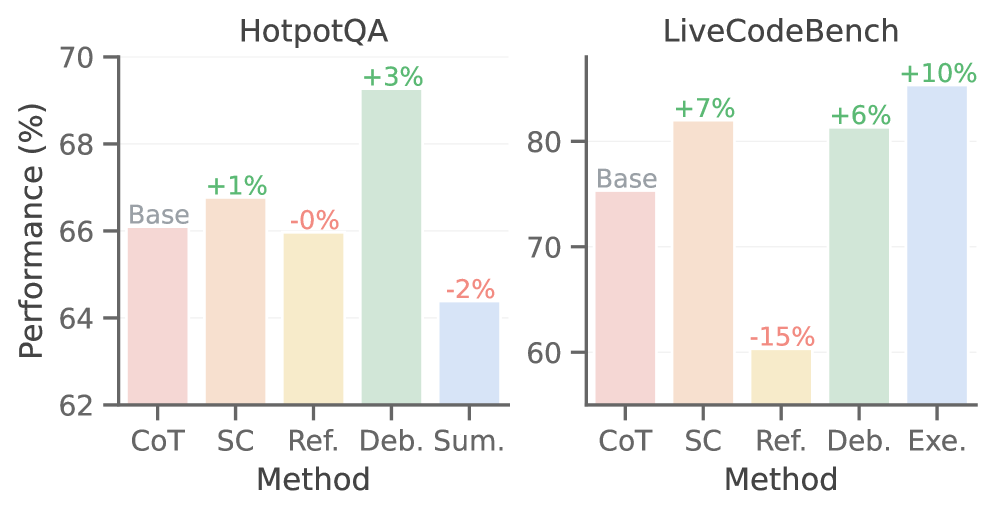
## Chart 1: HotpotQA Performance
### Axis Labels
- **X-axis**: Method (Categorical)
- Categories: CoT, SC, Ref., Deb., Sum.
- **Y-axis**: Performance (%)
- Range: 62% to 70%
- Tick Interval: 2%
### Data Points & Annotations
| Method | Base (%) | Change (%) | Performance (%) |
|--------|----------|------------|-----------------|
| CoT | 66 | - | 66 |
| SC | 66 | +1% | 67 |
| Ref. | 66 | -0% | 66 |
| Deb. | 66 | +3% | 69 |
| Sum. | 66 | -2% | 64 |
### Color Coding
- **Base**: Pink (no change)
- **Positive Changes**: Green (+1%, +3%)
- **Negative Changes**: Blue (-2%)
---
## Chart 2: LiveCodeBench Performance
### Axis Labels
- **X-axis**: Method (Categorical)
- Categories: CoT, SC, Ref., Deb., Exe.
- **Y-axis**: Performance (%)
- Range: 60% to 80%
- Tick Interval: 2%
### Data Points & Annotations
| Method | Base (%) | Change (%) | Performance (%) |
|--------|----------|------------|-----------------|
| CoT | 75 | - | 75 |
| SC | 75 | +7% | 82 |
| Ref. | 75 | -15% | 60 |
| Deb. | 75 | +6% | 81 |
| Exe. | 75 | +10% | 85 |
### Color Coding
- **Base**: Pink (no change)
- **Positive Changes**: Green (+7%, +6%, +10%)
- **Negative Changes**: Red (-15%)
---
## Key Observations
1. **HotpotQA**:
- **Best Performance**: Deb. method (69%)
- **Worst Performance**: Sum. method (64%)
- **Stability**: Ref. method matches Base performance (66%).
2. **LiveCodeBench**:
- **Best Performance**: Exe. method (85%)
- **Worst Performance**: Ref. method (60%)
- **Largest Improvement**: SC method (+7% from Base).
3. **Cross-Chart Trends**:
- Both charts show **method-specific performance variations** relative to a Base value.
- **Color-coded changes** indicate directional performance shifts (green for gains, red/blue for losses).