## Chart: Rate-Distortion: Meta-Token vs. Last-token VIB
### Overview
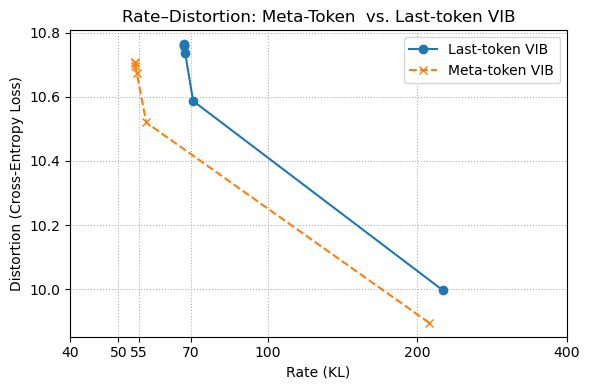
The image is a rate-distortion plot comparing "Meta-token VIB" and "Last-token VIB". The plot shows the relationship between Rate (KL) on the x-axis and Distortion (Cross-Entropy Loss) on the y-axis. Two data series are plotted: Last-token VIB (blue line with circle markers) and Meta-token VIB (dashed orange line with cross markers).
### Components/Axes
* **Title:** Rate-Distortion: Meta-Token vs. Last-token VIB
* **X-axis:** Rate (KL), with scale markers at 40, 50, 55, 70, 100, 200, and 400.
* **Y-axis:** Distortion (Cross-Entropy Loss), with scale markers at 10.0, 10.2, 10.4, 10.6, and 10.8.
* **Legend:** Located in the top-right corner of the chart.
* Blue line with circle markers: Last-token VIB
* Dashed orange line with cross markers: Meta-token VIB
### Detailed Analysis
**1. Last-token VIB (Blue line with circle markers):**
* **Trend:** The line generally slopes downward, indicating that as the Rate (KL) increases, the Distortion (Cross-Entropy Loss) decreases.
* **Data Points:**
* At Rate ~67 KL, Distortion ~10.75
* At Rate ~70 KL, Distortion ~10.58
* At Rate ~200 KL, Distortion ~10.0
**2. Meta-token VIB (Dashed orange line with cross markers):**
* **Trend:** The line generally slopes downward, indicating that as the Rate (KL) increases, the Distortion (Cross-Entropy Loss) decreases.
* **Data Points:**
* At Rate ~53 KL, Distortion ~10.7
* At Rate ~55 KL, Distortion ~10.5
* At Rate ~200 KL, Distortion ~9.9
### Key Observations
* Both "Last-token VIB" and "Meta-token VIB" show a decrease in Distortion as Rate increases.
* At lower rates (around 50-70 KL), "Meta-token VIB" has a lower distortion than "Last-token VIB".
* At higher rates (around 200 KL), "Meta-token VIB" has a lower distortion than "Last-token VIB".
### Interpretation
The rate-distortion plot compares the performance of two methods, "Meta-token VIB" and "Last-token VIB," in terms of their rate and distortion. The downward sloping curves indicate the trade-off between rate and distortion: as the rate (amount of information transmitted) increases, the distortion (loss of information) decreases.
The "Meta-token VIB" method appears to achieve lower distortion at similar rates compared to "Last-token VIB," suggesting it is a more efficient method for compressing information while preserving its quality. The difference is more pronounced at lower rates, indicating that "Meta-token VIB" might be particularly advantageous when bandwidth or storage is limited.