## Bar Chart: Rouge-L Score Comparison Across Models and Tasks
### Overview
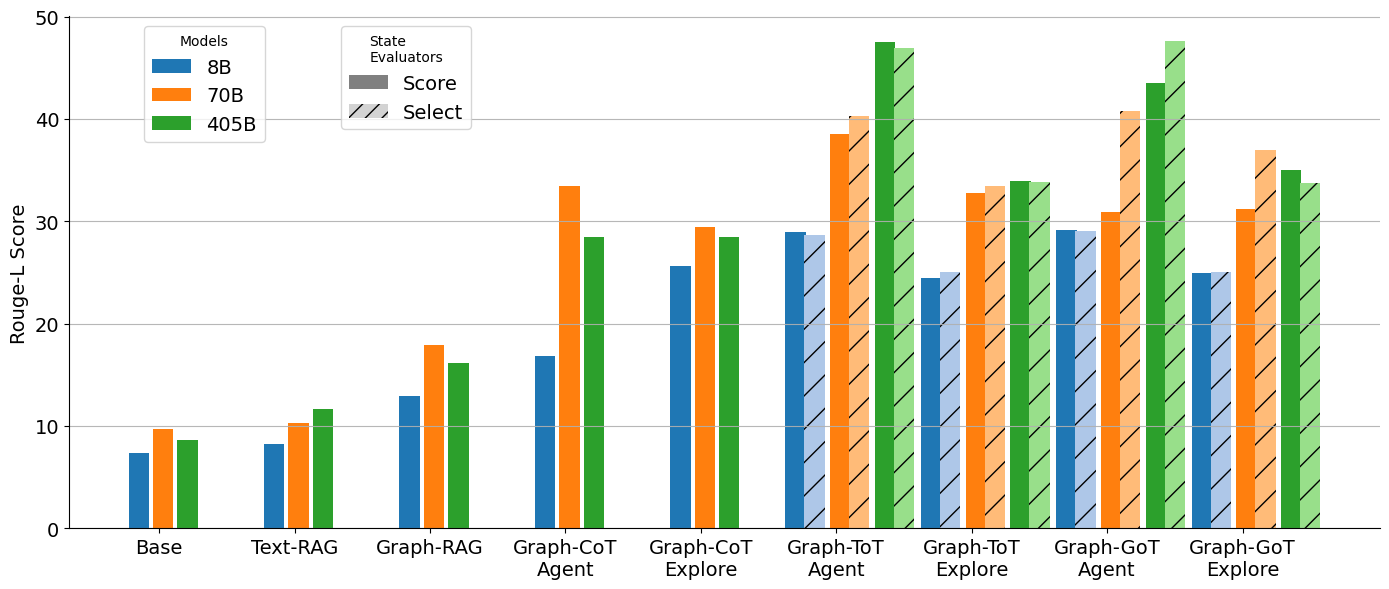
The chart compares Rouge-L scores for three models (8B, 70B, 405B) across 10 evaluation tasks. Tasks include Base, Text-RAG, Graph-RAG, Graph-CoT Agent/Explore, Graph-ToT Agent/Explore, and Graph-GoT Agent/Explore. The y-axis ranges from 0 to 50, with higher scores indicating better performance.
### Components/Axes
- **X-axis (Tasks)**: Base, Text-RAG, Graph-RAG, Graph-CoT Agent, Graph-CoT Explore, Graph-ToT Agent, Graph-ToT Explore, Graph-GoT Agent, Graph-GoT Explore.
- **Y-axis (Rouge-L Score)**: 0–50 scale.
- **Legend**:
- Blue = 8B model
- Orange = 70B model
- Green = 405B model
- **State Evaluators**: Score (solid bars) and Select (striped bars, not visible in data).
### Detailed Analysis
| Task | 8B | 70B | 405B |
|-----------------------|------|------|------|
| Base | ~7 | ~10 | ~9 |
| Text-RAG | ~8 | ~10 | ~12 |
| Graph-RAG | ~13 | ~18 | ~16 |
| Graph-CoT Agent | ~17 | ~33 | ~28 |
| Graph-CoT Explore | ~25 | ~29 | ~28 |
| Graph-ToT Agent | ~29 | ~39 | ~48 |
| Graph-ToT Explore | ~29 | ~33 | ~34 |
| Graph-GoT Agent | ~29 | ~41 | ~43 |
| Graph-GoT Explore | ~25 | ~31 | ~35 |
### Key Observations
- **Model Size Correlation**: Larger models (405B) generally outperform smaller ones, especially in complex tasks (e.g., Graph-ToT Agent: 405B = 48 vs. 8B = 29).
- **Anomalies**:
- In Graph-RAG, 70B (18) slightly outperforms 405B (16).
- 405B underperforms 70B in Graph-CoT Agent (28 vs. 33).
- **Task-Specific Trends**:
- Graph-ToT tasks show the largest performance gaps between models.
- Graph-GoT tasks maintain consistent 405B dominance.
### Interpretation
The data suggests that model size strongly correlates with performance in complex reasoning tasks (e.g., Graph-ToT), where 405B achieves ~48 vs. 8B’s 29. However, exceptions like Graph-RAG (70B > 405B) imply that architectural design or training data may sometimes outweigh raw model size. The 70B model’s mid-range performance highlights its potential as a cost-effective alternative to 405B in most scenarios. The 8B model’s consistent underperformance underscores limitations in handling advanced tasks, likely due to insufficient capacity for nuanced reasoning.