## Bar Chart: Rouge-L Score by Model and State Evaluator
### Overview
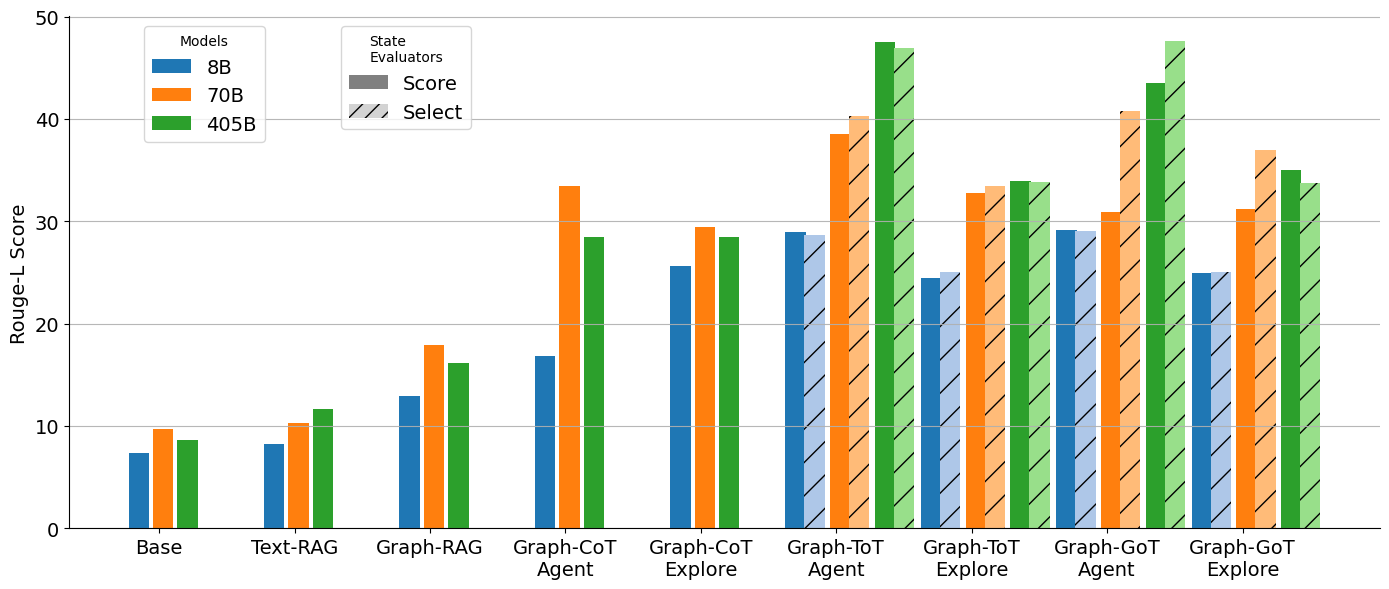
The image is a bar chart comparing the Rouge-L scores of different models (8B, 70B, 405B) across various tasks and state evaluators (Score, Select). The x-axis represents the tasks, and the y-axis represents the Rouge-L score. The chart uses different colored bars to represent the models and patterned bars to represent the state evaluators.
### Components/Axes
* **Y-axis:** "Rouge-L Score", ranging from 0 to 50, with gridlines at intervals of 10.
* **X-axis:** Categorical axis representing different tasks: "Base", "Text-RAG", "Graph-RAG", "Graph-CoT Agent", "Graph-CoT Explore", "Graph-ToT Agent", "Graph-ToT Explore", "Graph-GoT Agent", "Graph-GoT Explore".
* **Legend (Top-Left):**
* "Models":
* Blue: "8B"
* Orange: "70B"
* Green: "405B"
* "State Evaluators" (Top-Right):
* Gray: "Score" (Solid fill)
* Diagonal Lines: "Select" (Hatched fill)
### Detailed Analysis
Here's a breakdown of the Rouge-L scores for each task and model, considering both "Score" and "Select" state evaluators:
* **Base:**
* 8B (Score): ~7.5
* 70B (Score): ~10
* 405B (Score): ~9
* **Text-RAG:**
* 8B (Score): ~8.5
* 70B (Score): ~10.5
* 405B (Score): ~12
* **Graph-RAG:**
* 8B (Score): ~13
* 70B (Score): ~18
* 405B (Score): ~16.5
* **Graph-CoT Agent:**
* 8B (Score): ~17
* 70B (Score): ~33.5
* 405B (Score): ~28.5
* **Graph-CoT Explore:**
* 8B (Score): ~25.5
* 70B (Score): ~29
* 405B (Score): ~29
* **Graph-ToT Agent:**
* 8B (Score): ~29
* 70B (Score): ~39
* 405B (Score): ~48
* **Graph-ToT Explore:**
* 8B (Score): ~24.5 (Select)
* 70B (Score): ~33.5 (Select)
* 405B (Score): ~34 (Select)
* **Graph-GoT Agent:**
* 8B (Score): ~29
* 70B (Score): ~31
* 405B (Score): ~44
* **Graph-GoT Explore:**
* 8B (Score): ~24.5 (Select)
* 70B (Score): ~36 (Select)
* 405B (Score): ~34 (Select)
**Trends:**
* Generally, the Rouge-L score increases as the model size increases (8B < 70B < 405B).
* The "Graph-ToT Agent" task shows the highest Rouge-L scores for all models.
* The "Base" and "Text-RAG" tasks have the lowest Rouge-L scores.
* The "Select" state evaluator generally results in lower scores compared to the "Score" evaluator, especially for "Graph-ToT Explore" and "Graph-GoT Explore".
### Key Observations
* The 405B model consistently outperforms the 70B and 8B models across all tasks.
* The "Graph-ToT Agent" task appears to be the most effective, yielding the highest scores.
* The "Select" state evaluator seems to be more conservative or selective, resulting in lower scores.
### Interpretation
The data suggests that larger models (405B) generally achieve higher Rouge-L scores, indicating better performance in these tasks. The "Graph-ToT Agent" task seems to be particularly well-suited for these models, potentially due to its ability to leverage graph-based reasoning and agent-based exploration. The difference between "Score" and "Select" state evaluators highlights the impact of evaluation criteria on the reported performance. The "Select" evaluator might be prioritizing precision over recall, leading to lower overall scores but potentially higher-quality results. The performance increase from "Base" to "Text-RAG" to "Graph-RAG" suggests that incorporating graph-based information retrieval enhances the models' capabilities.