\n
## Bar Chart: Rouge-L Score vs. Models and State Evaluators
### Overview
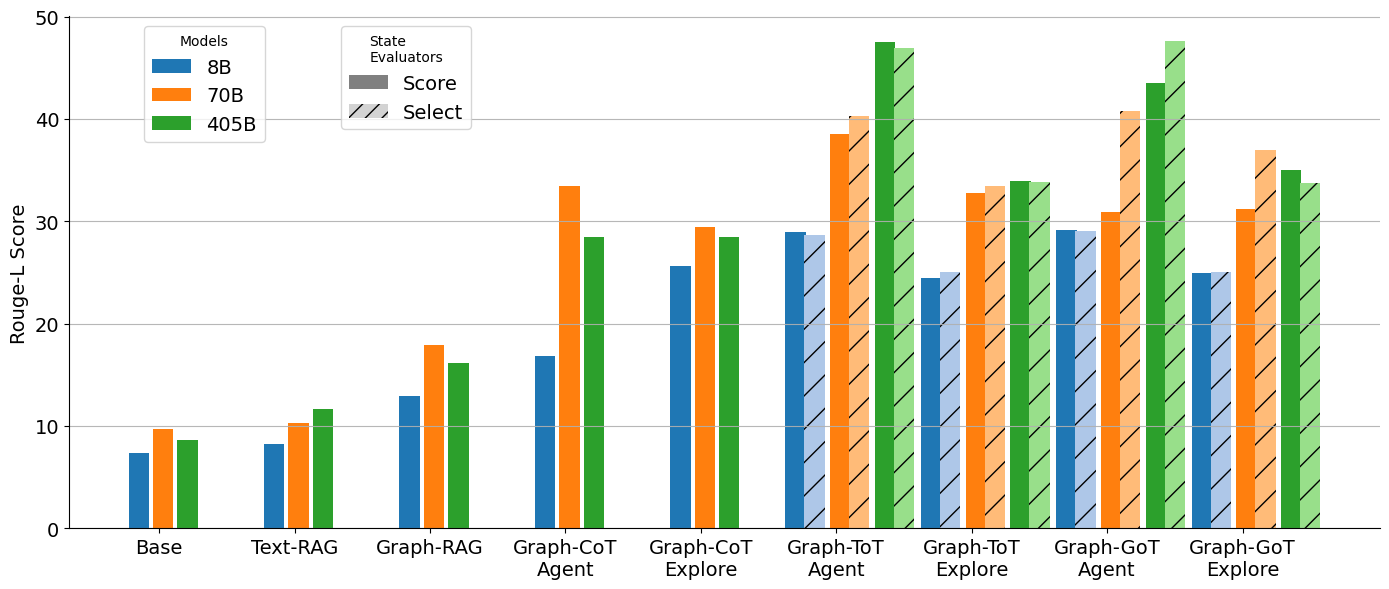
This bar chart compares the Rouge-L scores of different language models (8B, 70B, and 405B) across various state evaluators (Base, Text-RAG, Graph-RAG, Graph-CoT Agent, Graph-CoT Explore, Graph-ToT Agent, Graph-ToT Explore, Graph-GoT Agent, Graph-GoT Explore). The Rouge-L score is plotted on the y-axis, and the state evaluators are displayed on the x-axis. Each state evaluator has three bars representing the performance of the three models.
### Components/Axes
* **Y-axis:** Rouge-L Score (Scale: 0 to 50, increments of 10)
* **X-axis:** State Evaluators (Categories: Base, Text-RAG, Graph-RAG, Graph-CoT Agent, Graph-CoT Explore, Graph-ToT Agent, Graph-ToT Explore, Graph-GoT Agent, Graph-GoT Explore)
* **Legend:**
* Models:
* 8B (Blue)
* 70B (Orange)
* 405B (Green)
* State Evaluators:
* Score (Solid bars)
* Select (Hatched bars)
### Detailed Analysis
The chart consists of nine groups of three bars, one for each state evaluator. Within each group, the bars represent the Rouge-L scores for the 8B, 70B, and 405B models, respectively.
* **Base:**
* 8B: Approximately 7.
* 70B: Approximately 9.
* 405B: Approximately 8.
* **Text-RAG:**
* 8B: Approximately 10.
* 70B: Approximately 12.
* 405B: Approximately 11.
* **Graph-RAG:**
* 8B: Approximately 17.
* 70B: Approximately 20.
* 405B: Approximately 16.
* **Graph-CoT Agent:**
* 8B: Approximately 26.
* 70B: Approximately 34.
* 405B: Approximately 30.
* **Graph-CoT Explore:**
* 8B: Approximately 28.
* 70B: Approximately 30.
* 405B: Approximately 29.
* **Graph-ToT Agent:**
* 8B: Approximately 32.
* 70B: Approximately 35.
* 405B: Approximately 33.
* **Graph-ToT Explore:**
* 8B: Approximately 33.
* 70B: Approximately 34.
* 405B: Approximately 35.
* **Graph-GoT Agent:**
* 8B: Approximately 28.
* 70B: Approximately 32.
* 405B: Approximately 44.
* **Graph-GoT Explore:**
* 8B: Approximately 31.
* 70B: Approximately 33.
* 405B: Approximately 36.
Generally, the 405B model consistently outperforms the 8B and 70B models, especially in the Graph-GoT Agent state evaluator. The 70B model generally outperforms the 8B model.
### Key Observations
* The largest performance difference between models is observed with the "Graph-GoT Agent" state evaluator, where the 405B model achieves a significantly higher Rouge-L score (approximately 44) compared to the 8B (approximately 28) and 70B (approximately 32) models.
* The "Base" state evaluator shows the lowest Rouge-L scores across all models.
* The performance gap between the 8B and 70B models is relatively consistent across most state evaluators.
* The "Graph-ToT Explore" state evaluator shows the highest scores for the 405B model.
### Interpretation
The data suggests that increasing model size (from 8B to 70B to 405B) generally improves performance, as measured by the Rouge-L score. The choice of state evaluator significantly impacts performance, with "Graph-GoT Agent" yielding the most substantial gains from larger models. This indicates that the Graph-GoT Agent approach is particularly effective at leveraging the capabilities of larger language models. The low scores for the "Base" evaluator suggest that more sophisticated evaluation methods (like those involving graphs and CoT reasoning) are necessary to accurately assess the performance of these models. The consistent trend of larger models performing better supports the hypothesis that model capacity is a key factor in achieving higher Rouge-L scores. The differences between the "Agent" and "Explore" variants within the Graph-based evaluators suggest that the exploration strategy also plays a role in performance.