# Technical Document: GPT-4 Coherency Scores Analysis
## 1. Title and Overall Structure
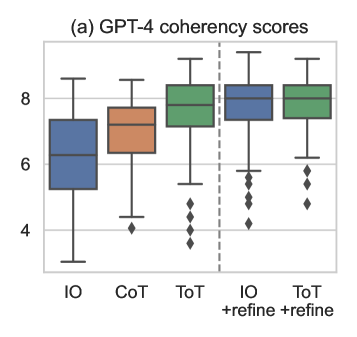
- **Title**: "GPT-4 coherency scores"
- **Chart Type**: Box plot
- **Purpose**: Visual comparison of coherency scores across different prompting strategies (IO, CoT, ToT) and their refined versions.
---
## 2. Axes and Labels
### X-Axis (Categories)
- **Labels**:
- IO (Input-Only)
- CoT (Chain-of-Thought)
- ToT (Tree-of-Thought)
- IO + refine
- ToT + refine
- **Spatial Grounding**:
- Categories are evenly spaced along the x-axis.
- The first three categories (IO, CoT, ToT) are separated by a dashed vertical line from the refined versions (IO + refine, ToT + refine).
### Y-Axis (Values)
- **Label**: "GPT-4 coherency scores"
- **Range**: 4 to 9 (inclusive)
- **Units**: Not explicitly stated, but implied as a numerical score.
---
## 3. Data Series and Colors
### Legend (Implied by Color Coding)
- **Colors**:
- **Blue**: IO (Input-Only) and IO + refine
- **Orange**: CoT (Chain-of-Thought)
- **Green**: ToT (Tree-of-Thought) and ToT + refine
- **Note**: No explicit legend is present in the image. Color coding is inferred from the x-axis labels and data series.
---
## 4. Key Data Points and Trends
### Box Plot Components
- **Median**: Represented by the horizontal line inside each box.
- **Interquartile Range (IQR)**: The height of the box (25th to 75th percentile).
- **Outliers**: Diamond-shaped markers outside the whiskers.
### Trends by Category
1. **IO (Blue)**:
- **Median**: ~6.5
- **Range**: ~4 to 8.5
- **Outliers**: 1–2 points below 4 and above 8.5.
2. **CoT (Orange)**:
- **Median**: ~7
- **Range**: ~5 to 8.5
- **Outliers**: 1–2 points below 5 and above 8.5.
3. **ToT (Green)**:
- **Median**: ~7.5
- **Range**: ~5.5 to 9
- **Outliers**: 1–2 points below 5.5 and above 9.
4. **IO + refine (Blue)**:
- **Median**: ~7
- **Range**: ~5.5 to 8.5
- **Outliers**: 1–2 points below 5.5 and above 8.5.
5. **ToT + refine (Green)**:
- **Median**: ~7.5
- **Range**: ~5.5 to 9
- **Outliers**: 1–2 points below 5.5 and above 9.
### Observations
- **Refinement Impact**:
- **IO + refine** shows a **1.0-point increase** in median compared to IO (6.5 → 7).
- **ToT + refine** maintains the same median as ToT (7.5) but with a slightly narrower range.
- **Consistency**:
- All refined categories (IO + refine, ToT + refine) exhibit **higher medians** than their non-refined counterparts.
- **ToT + refine** has the **highest median** (7.5) and **widest range** (5.5–9).
---
## 5. Spatial Grounding and Color Verification
- **Color Consistency**:
- **Blue** corresponds to **IO** and **IO + refine**.
- **Orange** corresponds to **CoT**.
- **Green** corresponds to **ToT** and **ToT + refine**.
- **Outlier Markers**: Diamond-shaped symbols are consistently used across all categories.
---
## 6. Component Isolation
### Header
- **Title**: "GPT-4 coherency scores" (top of the chart).
### Main Chart
- **X-Axis**: Categories (IO, CoT, ToT, IO + refine, ToT + refine).
- **Y-Axis**: Coherency scores (4–9).
- **Data Series**: Five box plots with distinct colors and outliers.
### Footer
- **No explicit footer text** in the image.
---
## 7. Additional Notes
- **No Explicit Legend**: Color coding is inferred from the x-axis labels and data series.
- **Outliers**: Present in all categories, with varying frequencies.
- **Refinement Strategy**: The "+ refine" suffix indicates an improved prompting method, which generally enhances coherency scores.
---
## 8. Conclusion
The chart demonstrates that **refinement strategies** (IO + refine, ToT + refine) improve coherency scores compared to their non-refined counterparts. **ToT + refine** achieves the highest median score (7.5), while **IO + refine** shows the most significant improvement (from 6.5 to 7). Outliers suggest variability in performance across different instances.