\n
## Diagram: Semiotic Model
### Overview
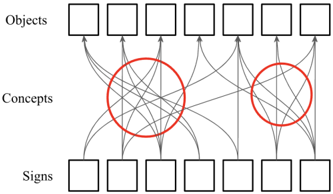
The image depicts a diagram illustrating a semiotic model, likely based on Charles Sanders Peirce's work. It shows relationships between "Objects," "Concepts," and "Signs" through a network of connecting lines. Two areas within the "Concepts" section are highlighted with red circles. The diagram does not contain numerical data, but rather a visual representation of connections and relationships.
### Components/Axes
The diagram is structured with three horizontal layers, labeled from top to bottom:
* **Objects:** A row of six rectangular boxes.
* **Concepts:** A central row of six rectangular boxes, with two areas highlighted by red circles.
* **Signs:** A bottom row of six rectangular boxes.
Connecting lines (gray) link each box in the "Objects" layer to multiple boxes in the "Concepts" layer, and each box in the "Concepts" layer to multiple boxes in the "Signs" layer. The lines represent relationships or associations between these elements.
### Detailed Analysis or Content Details
The diagram consists of the following elements:
* **Objects Layer:** Six unlabeled rectangular boxes arranged horizontally.
* **Concepts Layer:** Six unlabeled rectangular boxes arranged horizontally. Two distinct clusters of connections are highlighted within this layer by red circles. The left cluster appears more densely connected than the right cluster.
* **Signs Layer:** Six unlabeled rectangular boxes arranged horizontally.
* **Connections:** Numerous gray lines connect the layers. Each "Object" is connected to multiple "Concepts," and each "Concept" is connected to multiple "Signs." The connections are not uniform; some boxes have more connections than others.
There is no quantitative data present in the diagram. The information is purely relational and visual.
### Key Observations
* The diagram illustrates a complex network of relationships between Objects, Concepts, and Signs.
* The red circles highlight two distinct areas of conceptual connection, suggesting potentially different categories or types of concepts.
* The density of connections varies across the diagram, indicating that some elements have more relationships than others.
* The diagram is symmetrical in terms of the number of elements in each layer (six).
### Interpretation
This diagram likely represents a model of semiosis – the process of sign creation and interpretation. The "Objects" represent things in the world, the "Signs" represent representations of those things, and the "Concepts" represent the mental representations or ideas that mediate between the two.
The connections between the layers illustrate how objects come to be known through signs, mediated by concepts. The red circles could represent specific conceptual categories or clusters of related ideas. The differing density of connections within the circles suggests that some concepts are more central or have more associations than others.
The diagram suggests that the relationship between objects, concepts, and signs is not one-to-one, but rather many-to-many. A single object can be represented by multiple signs, and a single sign can refer to multiple objects. The concepts act as intermediaries, shaping how we understand the relationship between objects and signs.
The diagram is a visual metaphor for the complexity of meaning-making and the role of interpretation in understanding the world. It doesn't provide specific data, but rather a framework for thinking about how meaning is constructed. It is a conceptual model, not a data visualization.