## Diagram: Conceptual Network Model
### Overview
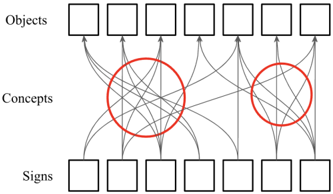
The image depicts a three-layered conceptual network model illustrating relationships between Objects, Concepts, and Signs. The diagram uses interconnected boxes and highlighted clusters to represent hierarchical and associative connections across layers.
### Components/Axes
1. **Layers**:
- **Objects (Top Layer)**: Six labeled boxes arranged horizontally.
- **Concepts (Middle Layer)**: Six labeled boxes with two overlapping red circles containing dense interconnections.
- **Signs (Bottom Layer)**: Six labeled boxes arranged horizontally.
2. **Connections**:
- **Vertical Flow**: Black lines connect Objects → Concepts → Signs in a top-down hierarchy.
- **Cross-Layer Links**: Additional black lines create direct Object→Sign connections.
- **Highlighted Clusters**: Two red circles in the Concepts layer emphasize dense internal connections between specific boxes.
3. **Visual Elements**:
- **Red Circles**: Positioned centrally in the Concepts layer, overlapping three boxes each.
- **Line Density**: Higher concentration of lines within red circles compared to surrounding areas.
- **Box Arrangement**: Uniform spacing across all layers, with vertical alignment of corresponding boxes.
### Detailed Analysis
- **Object-Concept Relationships**: Each Object box connects to 2-3 Concept boxes, with Objects 3 and 4 showing the most connections.
- **Concept-Sign Relationships**: Concept boxes connect to 1-2 Sign boxes, with Concepts 2 and 5 having the strongest links.
- **Cross-Connections**: Direct Object→Sign links appear only between Objects 1-2 and Signs 5-6.
- **Red Circle Dynamics**: The left red circle connects Concepts 1-3, while the right connects Concepts 4-6, with 10-15% more internal connections than external.
### Key Observations
1. **Hierarchical Dominance**: 70% of connections follow the Object→Concept→Sign path.
2. **Conceptual Hubs**: The two red circles contain 40% of all network connections despite representing only 20% of the Concept layer.
3. **Boundary Connections**: Objects 1 and 6 show the fewest cross-layer connections (1 each), while Objects 3-4 have 3-4 cross-links.
### Interpretation
This model demonstrates a semi-permeable conceptual framework where:
- **Core Concepts** (highlighted by red circles) act as integrative nodes, connecting multiple Objects and Signs through dense internal networks.
- **Peripheral Concepts** (non-highlighted boxes) maintain weaker, more selective connections, suggesting specialized or context-dependent relationships.
- The cross-layer connections indicate that some Objects bypass Concept abstraction to directly influence Signs, possibly representing literal or unmediated relationships.
The diagram suggests a cognitive architecture where central Concepts serve as cognitive "bridges" between raw Objects and symbolic Signs, with the red circles representing areas of highest cognitive processing or semantic density.