\n
## Diagram: Basis Vectors and Rectangle
### Overview
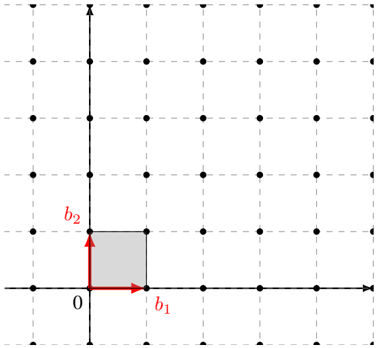
The image depicts a two-dimensional Cartesian coordinate system with a grid of points. A rectangle is defined by the origin (0) and two basis vectors, labeled *b1* and *b2*. The rectangle is shaded gray. The grid appears to be composed of equally spaced points.
### Components/Axes
* **Axes:** Two perpendicular axes are present, representing the x and y coordinates. The x-axis is horizontal, and the y-axis is vertical.
* **Origin:** The intersection of the axes is labeled "0".
* **Basis Vectors:**
* *b1*: A red arrow pointing along the positive x-axis.
* *b2*: A red arrow pointing along the positive y-axis.
* **Rectangle:** A shaded gray rectangle is formed by the basis vectors *b1* and *b2* as adjacent sides, with the origin as one vertex.
* **Grid:** A grid of black dots extends across the coordinate plane, providing a visual reference for scale and position.
### Detailed Analysis
The rectangle's vertices are located at:
* (0, 0) - The origin.
* (b1, 0) - Along the x-axis, defined by the length of vector *b1*.
* (0, b2) - Along the y-axis, defined by the length of vector *b2*.
* (b1, b2) - The opposite vertex from the origin.
The lengths of the basis vectors *b1* and *b2* are not explicitly given numerically. However, based on the grid, it appears that *b1* and *b2* are both approximately equal to 1 grid unit in length. The rectangle occupies one grid square.
### Key Observations
* The basis vectors *b1* and *b2* are orthogonal (perpendicular) to each other.
* The rectangle is aligned with the coordinate axes.
* The rectangle's area is defined by the product of the lengths of *b1* and *b2*.
* The grid provides a visual representation of a lattice structure defined by the basis vectors.
### Interpretation
This diagram illustrates the concept of basis vectors in a two-dimensional space. The basis vectors *b1* and *b2* define a coordinate system, and any point within the plane can be represented as a linear combination of these vectors. The rectangle demonstrates how these vectors can be used to define a region or shape within the coordinate system. The diagram is likely used to explain concepts in linear algebra, vector spaces, or geometry. The grid suggests a discrete representation of the continuous plane, potentially relating to concepts like lattice structures or digital images. The diagram does not provide any specific numerical data beyond the visual representation of the lengths of *b1* and *b2* relative to the grid.