## Diagram: Vector Basis Representation in 2D Grid
### Overview
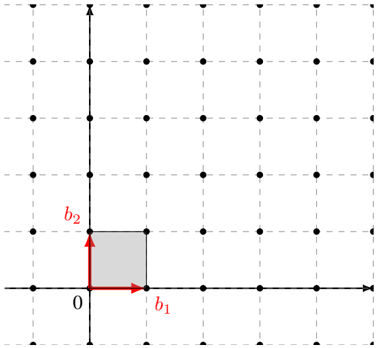
The image depicts a 2D Cartesian coordinate system with a grid of equidistant points. A shaded rectangular region is highlighted in the lower-left quadrant, with two vectors labeled **b₁** and **b₂** originating from the origin (0,0). The vectors are aligned with the grid axes, suggesting a basis representation.
### Components/Axes
- **Grid Structure**:
- Horizontal and vertical axes intersect at the origin (0,0).
- Grid lines are evenly spaced, forming a lattice of 1x1 squares.
- No explicit axis labels or numerical scales are visible.
- **Vectors**:
- **b₁**: Red arrow pointing right along the horizontal axis.
- **b₂**: Red arrow pointing upward along the vertical axis.
- **Shaded Region**:
- A gray rectangle bounded by the origin, **b₁**, **b₂**, and the vector sum **b₁ + b₂**.
- Positioned in the first quadrant, spanning 1 unit along both axes.
### Detailed Analysis
- **Vector Labels**:
- **b₁** and **b₂** are explicitly labeled with red arrows.
- No numerical magnitudes or directional angles are provided.
- **Grid Spacing**:
- Each grid square appears to represent a unit length, though no scale is confirmed.
- **Shaded Area**:
- The rectangle’s corners align with grid intersections, implying integer coordinates (0,0), (1,0), (0,1), and (1,1).
### Key Observations
- The vectors **b₁** and **b₂** form an orthogonal basis for the grid, consistent with standard Cartesian coordinates.
- The shaded region represents the unit cell defined by the basis vectors.
- No additional data points, annotations, or textual information are present.
### Interpretation
This diagram illustrates a fundamental concept in linear algebra and vector spaces: the representation of a 2D grid using an orthogonal basis. The shaded unit cell emphasizes the geometric relationship between the basis vectors and the grid structure. The absence of numerical labels suggests the focus is on the conceptual relationship rather than quantitative analysis. The simplicity of the diagram implies it may serve as an introductory visualization for topics like coordinate systems, vector addition, or lattice structures.