\n
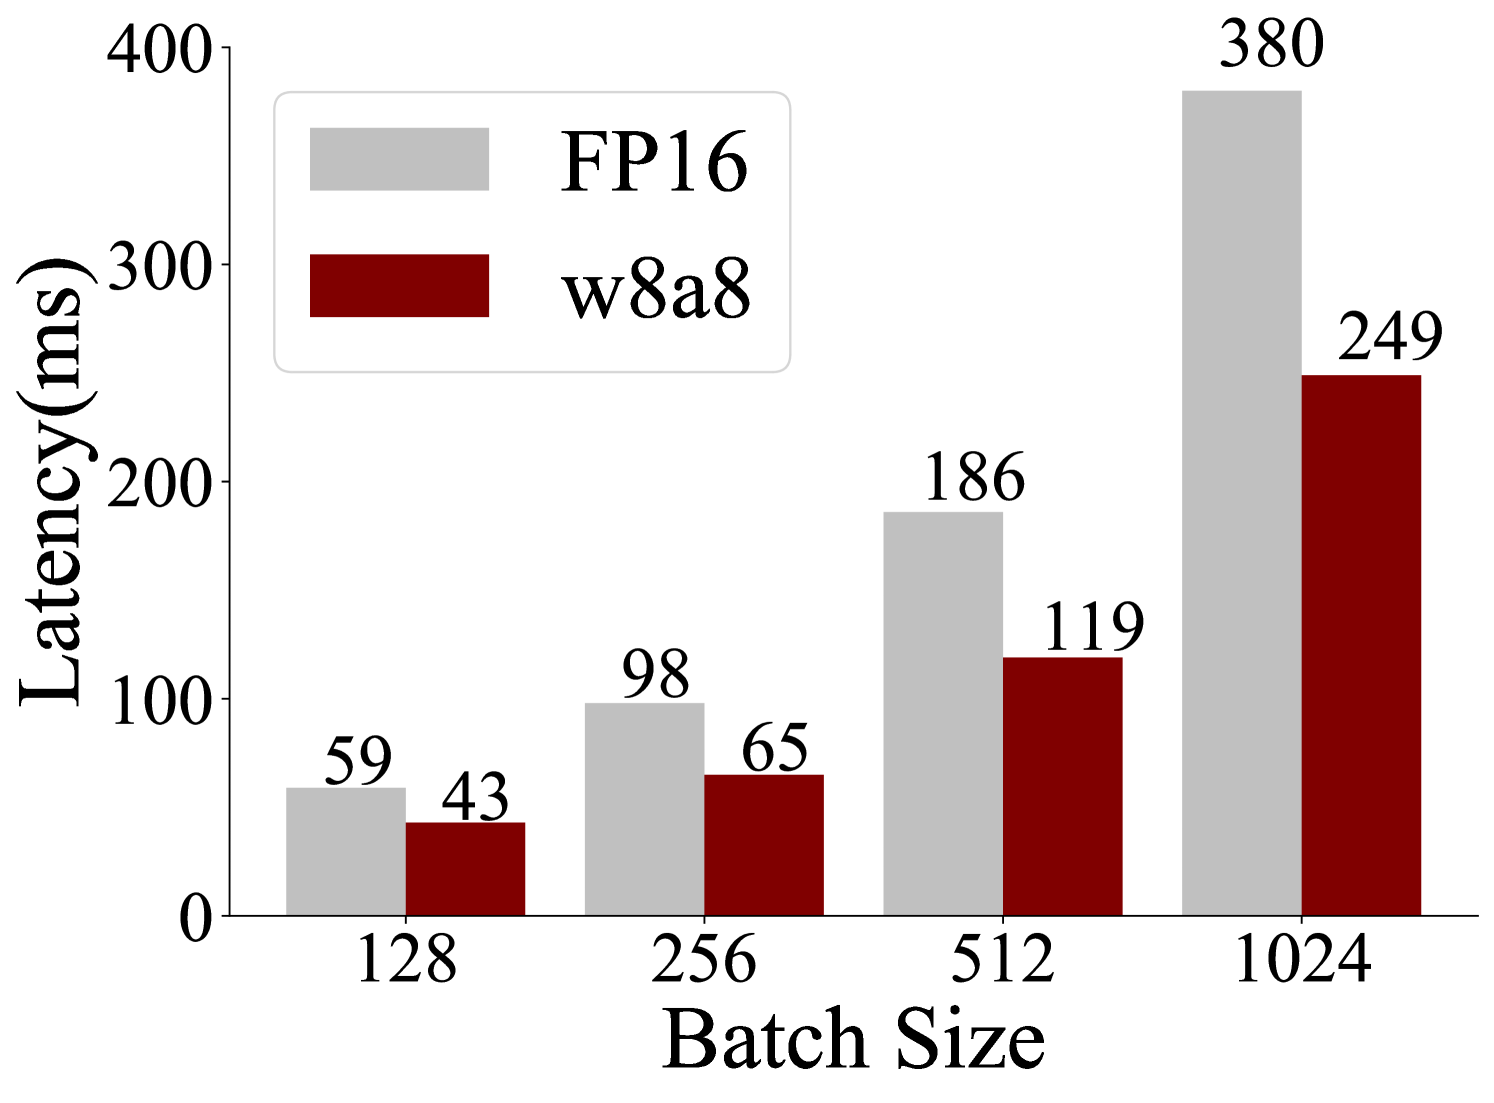
## Bar Chart: Latency vs. Batch Size for FP16 and w8a8
### Overview
This bar chart compares the latency (in milliseconds) of two data types, FP16 and w8a8, across different batch sizes. The batch sizes are 128, 256, 512, and 1024. The chart visually represents the relationship between batch size and latency for each data type.
### Components/Axes
* **X-axis:** Batch Size (labeled at the bottom). Markers are 128, 256, 512, and 1024.
* **Y-axis:** Latency (ms) (labeled on the left). Scale ranges from 0 to 400.
* **Legend:** Located in the top-left corner.
* FP16: Represented by light gray bars.
* w8a8: Represented by dark red bars.
### Detailed Analysis
The chart consists of paired bars for each batch size, representing FP16 and w8a8 latency.
* **Batch Size 128:**
* FP16: Approximately 59 ms.
* w8a8: Approximately 43 ms.
* **Batch Size 256:**
* FP16: Approximately 98 ms.
* w8a8: Approximately 65 ms.
* **Batch Size 512:**
* FP16: Approximately 186 ms.
* w8a8: Approximately 119 ms.
* **Batch Size 1024:**
* FP16: Approximately 380 ms.
* w8a8: Approximately 249 ms.
**Trends:**
* **FP16:** The latency increases consistently as the batch size increases. The increase appears roughly linear.
* **w8a8:** The latency also increases consistently with batch size, and also appears roughly linear.
### Key Observations
* For all batch sizes, w8a8 consistently exhibits lower latency than FP16.
* The difference in latency between FP16 and w8a8 increases as the batch size increases. At a batch size of 128, the difference is about 16ms, while at a batch size of 1024, the difference is about 131ms.
* The latency values are all positive, as expected.
### Interpretation
The data suggests that using the w8a8 data type results in lower latency compared to FP16 across all tested batch sizes. This is likely due to the reduced precision of w8a8, which requires less computational resources. The increasing latency with larger batch sizes is expected, as processing larger batches requires more computation. The widening gap in latency between the two data types as batch size increases indicates that the benefits of using w8a8 become more pronounced when dealing with larger batches. This information is valuable for optimizing performance in machine learning or other applications where latency is critical, and choosing the appropriate data type based on batch size can significantly impact overall efficiency. The linear trend suggests a predictable relationship between batch size and latency for both data types.