\n
## Bar Chart: Latency vs. Batch Size for FP16 and w8a8 Precision
### Overview
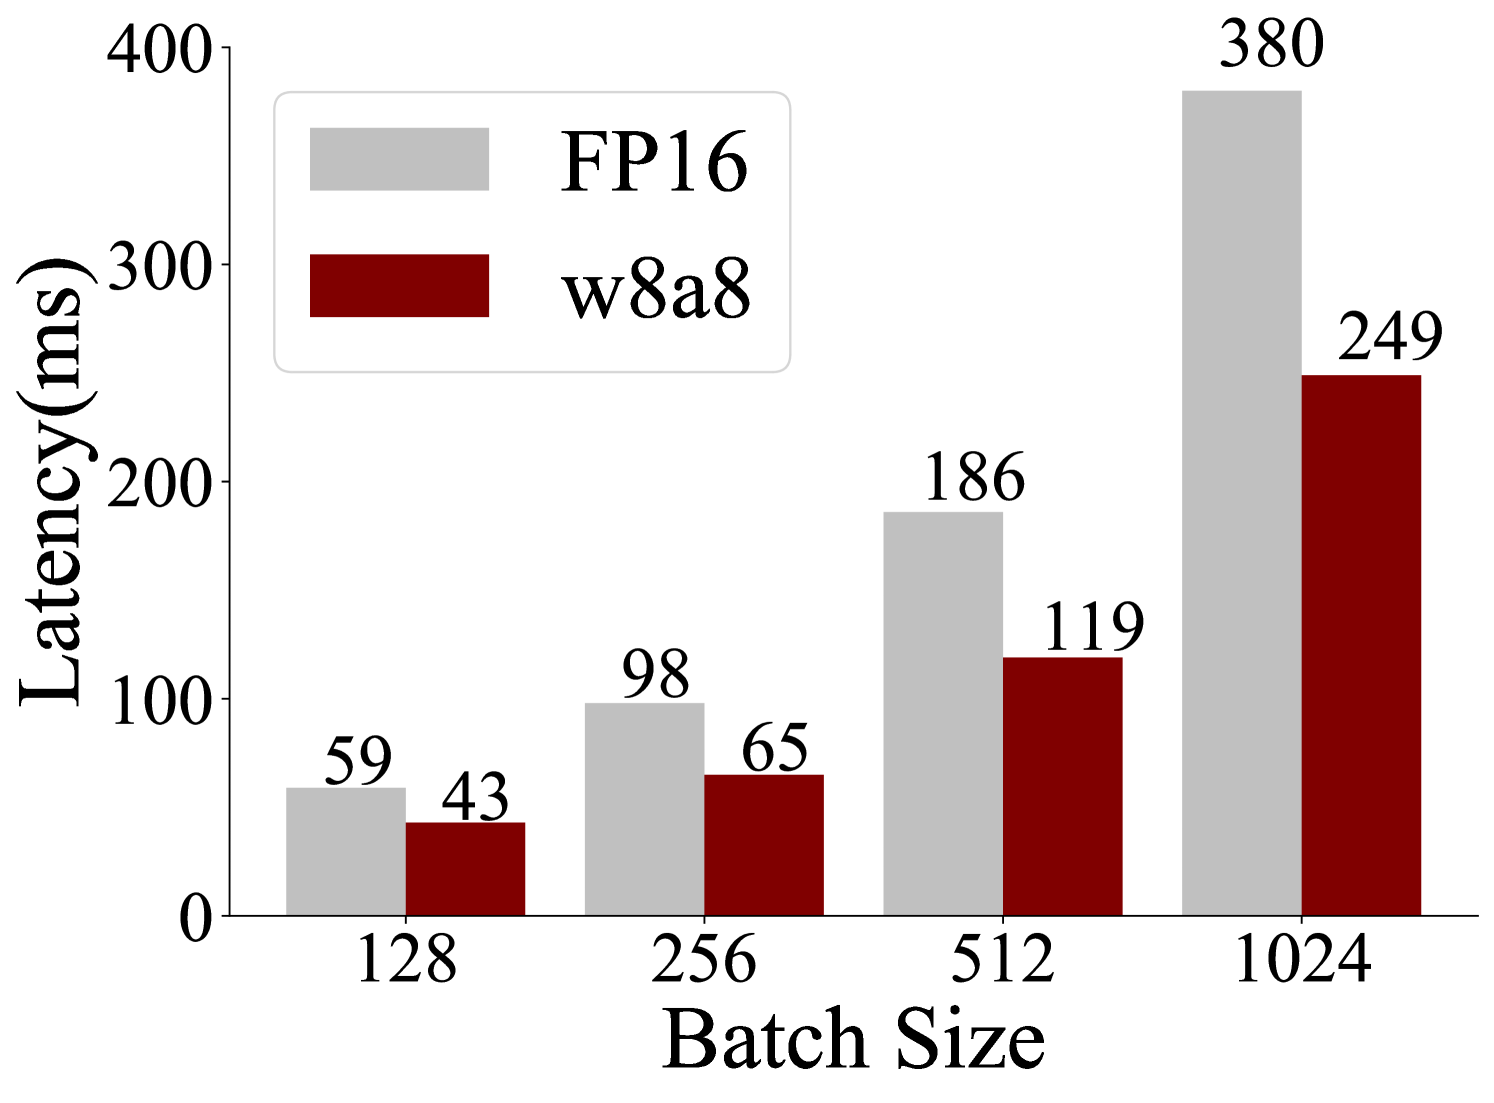
This is a grouped bar chart comparing the inference latency (in milliseconds) of two different numerical precision formats—FP16 (16-bit floating point) and w8a8 (8-bit weights and 8-bit activations)—across four increasing batch sizes. The chart demonstrates the performance advantage of the w8a8 quantization format over the FP16 baseline.
### Components/Axes
* **Chart Type:** Grouped Bar Chart.
* **Y-Axis:** Labeled **"Latency(ms)"**. The scale runs from 0 to 400 with major tick marks at 0, 100, 200, 300, and 400.
* **X-Axis:** Labeled **"Batch Size"**. It displays four discrete categories: **128**, **256**, **512**, and **1024**.
* **Legend:** Positioned in the **top-left corner** of the chart area.
* A light gray rectangle corresponds to the label **"FP16"**.
* A dark red (maroon) rectangle corresponds to the label **"w8a8"**.
* **Data Series:** Two series are plotted for each batch size category.
* **Series 1 (FP16):** Light gray bars, positioned on the left within each group.
* **Series 2 (w8a8):** Dark red bars, positioned on the right within each group.
* **Data Labels:** The exact latency value in milliseconds is printed directly above each bar.
### Detailed Analysis
The chart presents the following precise data points:
| Batch Size | FP16 Latency (ms) | w8a8 Latency (ms) |
| :--- | :--- | :--- |
| **128** | 59 | 43 |
| **256** | 98 | 65 |
| **512** | 186 | 119 |
| **1024** | 380 | 249 |
**Trend Verification:**
* **FP16 Series (Light Gray):** The bar heights show a clear, steep upward trend. Latency increases significantly with each doubling of the batch size, from 59 ms at 128 to 380 ms at 1024.
* **w8a8 Series (Dark Red):** The bar heights also show a consistent upward trend, but the slope is less steep than the FP16 series. Latency increases from 43 ms at 128 to 249 ms at 1024.
### Key Observations
1. **Consistent Performance Advantage:** For every batch size, the w8a8 format exhibits lower latency than the FP16 format.
2. **Widening Performance Gap:** The absolute difference in latency between FP16 and w8a8 grows as the batch size increases.
* At batch size 128, the difference is 16 ms.
* At batch size 1024, the difference is 131 ms.
3. **Scaling Behavior:** Both precision formats show latency that scales roughly linearly with batch size within this range, but the scaling factor (the slope) is lower for w8a8.
### Interpretation
The data demonstrates the efficacy of the **w8a8 quantization technique** in reducing computational latency for inference tasks compared to the standard **FP16** precision. The key insight is that the performance benefit of w8a8 becomes **more pronounced at larger batch sizes**.
This suggests that w8a8 is particularly advantageous for high-throughput scenarios where processing large batches of data simultaneously is common (e.g., in data centers or batch processing pipelines). The reduced latency at scale implies potential for higher system throughput, lower operational costs, or the ability to handle more concurrent requests within a given time frame. The chart provides a clear, quantitative argument for adopting w8a8 precision in performance-sensitive deployment environments.