## Bar Chart: Latency Comparison Between FP16 and w8a8 Methods
### Overview
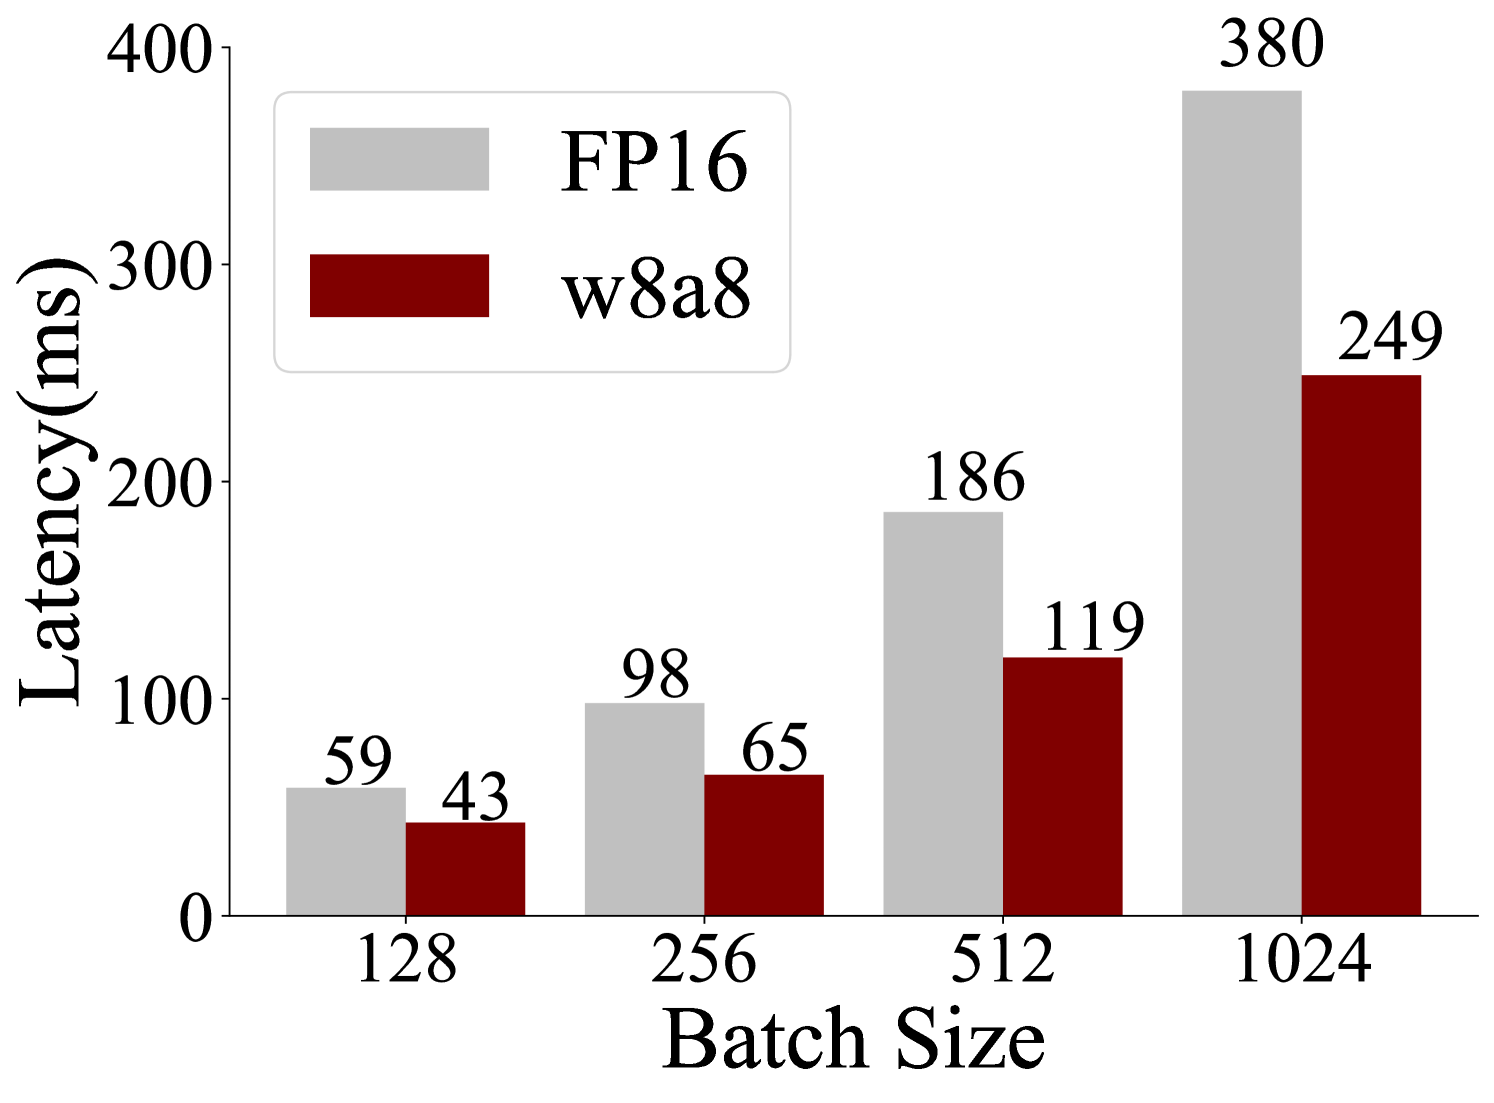
The chart compares latency (in milliseconds) for two computational methods, **FP16** (gray bars) and **w8a8** (red bars), across four batch sizes: 128, 256, 512, and 1024. Latency increases with batch size for both methods, but FP16 consistently exhibits higher latency than w8a8.
### Components/Axes
- **X-axis (Batch Size)**: Labeled "Batch Size" with discrete categories: 128, 256, 512, 1024.
- **Y-axis (Latency)**: Labeled "Latency (ms)" with a scale from 0 to 400.
- **Legend**: Located in the top-left corner, associating gray with FP16 and red with w8a8.
- **Bars**: Paired bars for each batch size, with numerical values labeled on top of each bar.
### Detailed Analysis
- **Batch Size 128**:
- FP16: 59 ms (gray bar)
- w8a8: 43 ms (red bar)
- **Batch Size 256**:
- FP16: 98 ms (gray bar)
- w8a8: 65 ms (red bar)
- **Batch Size 512**:
- FP16: 186 ms (gray bar)
- w8a8: 119 ms (red bar)
- **Batch Size 1024**:
- FP16: 380 ms (gray bar)
- w8a8: 249 ms (red bar)
### Key Observations
1. **FP16 vs. w8a8**: FP16 latency is consistently higher than w8a8 across all batch sizes.
2. **Scaling Trend**: Latency increases with batch size for both methods, but the gap widens at larger batches (e.g., 1024: FP16 = 380 ms vs. w8a8 = 249 ms).
3. **Efficiency**: w8a8 demonstrates ~25–30% lower latency than FP16 at equivalent batch sizes.
### Interpretation
The data suggests that **w8a8** is more computationally efficient than FP16, particularly at larger batch sizes. The widening latency gap at 1024 indicates that FP16’s performance degrades more significantly under high-load conditions. This could reflect differences in hardware optimization, precision handling, or algorithmic overhead between the two methods. For applications prioritizing speed, w8a8 may be preferable, though FP16 might offer advantages in accuracy or compatibility not captured here.