## Chart: LM Loss vs. PFLOP/s-days for MoBA and Full Attention Projections
### Overview
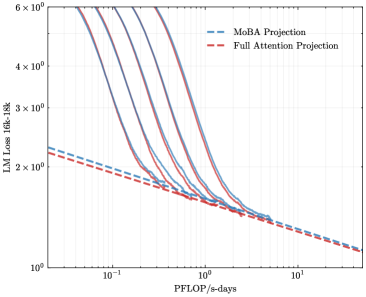
The image is a line chart comparing the Language Model (LM) Loss of MoBA Projection and Full Attention Projection models against PFLOP/s-days (a measure of computational cost). The y-axis represents LM Loss from 16k to 18k, and the x-axis represents PFLOP/s-days. The chart includes multiple lines for each projection type, showing performance at different scales or configurations.
### Components/Axes
* **Title:** Implicit: LM Loss vs. PFLOP/s-days
* **X-axis:** PFLOP/s-days (logarithmic scale)
* Axis Markers: 10<sup>-1</sup>, 10<sup>0</sup>, 10<sup>1</sup>
* **Y-axis:** LM Loss 16k-18k (logarithmic scale)
* Axis Markers: 2 x 10<sup>0</sup>, 3 x 10<sup>0</sup>, 4 x 10<sup>0</sup>, 6 x 10<sup>0</sup>
* **Legend:** Located at the top-right of the chart.
* MoBA Projection (dashed blue line)
* Full Attention Projection (dashed red line)
### Detailed Analysis
* **MoBA Projection:** Multiple solid blue lines. Each line represents a different model configuration.
* Trend: Each line shows a decreasing LM Loss as PFLOP/s-days increases. The lines start with a steep decline, which gradually flattens out.
* Data Points (Approximate):
* At 0.1 PFLOP/s-days, LM Loss ranges from approximately 4.0 x 10<sup>0</sup> to 6.0 x 10<sup>0</sup>.
* At 1 PFLOP/s-days, LM Loss ranges from approximately 1.5 x 10<sup>0</sup> to 2.0 x 10<sup>0</sup>.
* At 10 PFLOP/s-days, LM Loss is approximately 1.2 x 10<sup>0</sup>.
* **Full Attention Projection:** Dashed red line.
* Trend: The line shows a decreasing LM Loss as PFLOP/s-days increases. The decline is more gradual and consistent compared to the MoBA Projection lines.
* Data Points (Approximate):
* At 0.1 PFLOP/s-days, LM Loss is approximately 2.2 x 10<sup>0</sup>.
* At 1 PFLOP/s-days, LM Loss is approximately 1.6 x 10<sup>0</sup>.
* At 10 PFLOP/s-days, LM Loss is approximately 1.2 x 10<sup>0</sup>.
### Key Observations
* The MoBA Projection models initially have a higher LM Loss compared to the Full Attention Projection model at lower PFLOP/s-days.
* As PFLOP/s-days increases, the LM Loss for both MoBA and Full Attention Projections converges.
* The MoBA Projection models show a more rapid initial decrease in LM Loss compared to the Full Attention Projection model.
### Interpretation
The chart compares the performance of MoBA Projection and Full Attention Projection models in terms of LM Loss and computational cost (PFLOP/s-days). The data suggests that while MoBA Projection models may initially have a higher LM Loss, they can achieve comparable or even better performance than Full Attention Projection models with increased computational resources. The steeper decline in LM Loss for MoBA Projection models indicates that they may be more efficient in reducing loss with additional computation, at least initially. The convergence of LM Loss at higher PFLOP/s-days suggests that both model types can achieve similar levels of performance given sufficient computational resources. The multiple lines for MoBA Projection likely represent different model sizes or configurations, showing the trade-off between model complexity and performance.