## Line Chart: LM Loss vs. PFLOP/s-days
### Overview
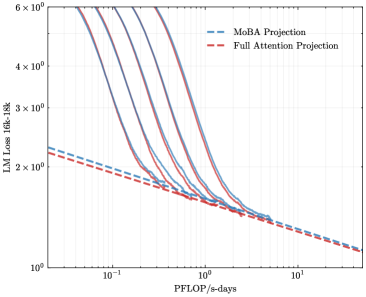
This image presents a line chart comparing the Language Model (LM) Loss of two projection methods – MoBA Projection and Full Attention Projection – as a function of PFLOP/s-days (floating point operations per second per day). Multiple lines are shown for each projection method, likely representing different runs or configurations. The chart uses a logarithmic scale for both the y-axis (LM Loss) and the x-axis (PFLOP/s-days).
### Components/Axes
* **X-axis:** PFLOP/s-days, ranging from approximately 10<sup>-2</sup> to 10<sup>1</sup> (logarithmic scale).
* **Y-axis:** LM Loss 16k-18k, ranging from approximately 10<sup>0</sup> to 6 x 10<sup>6</sup> (logarithmic scale).
* **Legend:** Located in the top-right corner.
* MoBA Projection (blue dashed line)
* Full Attention Projection (red solid line)
* **Lines:** Multiple lines are plotted for each projection method. There are approximately 6 lines for each method.
### Detailed Analysis
**MoBA Projection (Blue Dashed Line):**
The MoBA Projection lines generally exhibit a downward trend as PFLOP/s-days increase.
* Line 1: Starts at approximately 2.5 x 10<sup>2</sup> LM Loss at 10<sup>-2</sup> PFLOP/s-days, decreasing to approximately 2 x 10<sup>1</sup> LM Loss at 10<sup>1</sup> PFLOP/s-days.
* Line 2: Starts at approximately 2 x 10<sup>2</sup> LM Loss at 10<sup>-2</sup> PFLOP/s-days, decreasing to approximately 1.5 x 10<sup>1</sup> LM Loss at 10<sup>1</sup> PFLOP/s-days.
* Line 3: Starts at approximately 1.5 x 10<sup>2</sup> LM Loss at 10<sup>-2</sup> PFLOP/s-days, decreasing to approximately 1 x 10<sup>1</sup> LM Loss at 10<sup>1</sup> PFLOP/s-days.
* Line 4: Starts at approximately 1 x 10<sup>2</sup> LM Loss at 10<sup>-2</sup> PFLOP/s-days, decreasing to approximately 7 x 10<sup>0</sup> LM Loss at 10<sup>1</sup> PFLOP/s-days.
* Line 5: Starts at approximately 7 x 10<sup>1</sup> LM Loss at 10<sup>-2</sup> PFLOP/s-days, decreasing to approximately 5 x 10<sup>0</sup> LM Loss at 10<sup>1</sup> PFLOP/s-days.
* Line 6: Starts at approximately 5 x 10<sup>1</sup> LM Loss at 10<sup>-2</sup> PFLOP/s-days, decreasing to approximately 3 x 10<sup>0</sup> LM Loss at 10<sup>1</sup> PFLOP/s-days.
**Full Attention Projection (Red Solid Line):**
The Full Attention Projection lines also show a downward trend, but generally start at higher LM Loss values and decrease more rapidly than the MoBA Projection lines.
* Line 1: Starts at approximately 5 x 10<sup>3</sup> LM Loss at 10<sup>-2</sup> PFLOP/s-days, decreasing to approximately 2 x 10<sup>1</sup> LM Loss at 10<sup>1</sup> PFLOP/s-days.
* Line 2: Starts at approximately 4 x 10<sup>3</sup> LM Loss at 10<sup>-2</sup> PFLOP/s-days, decreasing to approximately 1.5 x 10<sup>1</sup> LM Loss at 10<sup>1</sup> PFLOP/s-days.
* Line 3: Starts at approximately 3 x 10<sup>3</sup> LM Loss at 10<sup>-2</sup> PFLOP/s-days, decreasing to approximately 1 x 10<sup>1</sup> LM Loss at 10<sup>1</sup> PFLOP/s-days.
* Line 4: Starts at approximately 2 x 10<sup>3</sup> LM Loss at 10<sup>-2</sup> PFLOP/s-days, decreasing to approximately 7 x 10<sup>0</sup> LM Loss at 10<sup>1</sup> PFLOP/s-days.
* Line 5: Starts at approximately 1 x 10<sup>3</sup> LM Loss at 10<sup>-2</sup> PFLOP/s-days, decreasing to approximately 5 x 10<sup>0</sup> LM Loss at 10<sup>1</sup> PFLOP/s-days.
* Line 6: Starts at approximately 5 x 10<sup>2</sup> LM Loss at 10<sup>-2</sup> PFLOP/s-days, decreasing to approximately 3 x 10<sup>0</sup> LM Loss at 10<sup>1</sup> PFLOP/s-days.
### Key Observations
* Both projection methods demonstrate a decrease in LM Loss as PFLOP/s-days increase, indicating improved model performance with more computational resources.
* The Full Attention Projection consistently exhibits higher LM Loss values than the MoBA Projection across the entire range of PFLOP/s-days.
* The multiple lines for each method suggest variability in performance, potentially due to different initialization, hyperparameters, or data splits.
* The rate of decrease in LM Loss appears to slow down as PFLOP/s-days increase for both methods, suggesting diminishing returns from additional computation.
### Interpretation
The chart suggests that the MoBA Projection method is more efficient than the Full Attention Projection method in terms of LM Loss per PFLOP/s-days. MoBA achieves comparable or lower loss with less computational cost. The multiple lines for each method indicate that the performance is not deterministic and can vary. The logarithmic scales highlight the significant impact of even small increases in PFLOP/s-days at lower computational budgets. The diminishing returns observed at higher PFLOP/s-days suggest that there is a point beyond which further increasing computational resources yields only marginal improvements in LM Loss. This information is valuable for resource allocation and model optimization, as it helps determine the optimal balance between computational cost and model performance. The chart implies that MoBA is a more scalable approach, as it requires fewer resources to achieve a given level of performance.