\n
## Bar Chart: Number of Tokens After First Step vs. Pass@1 of qτ
### Overview
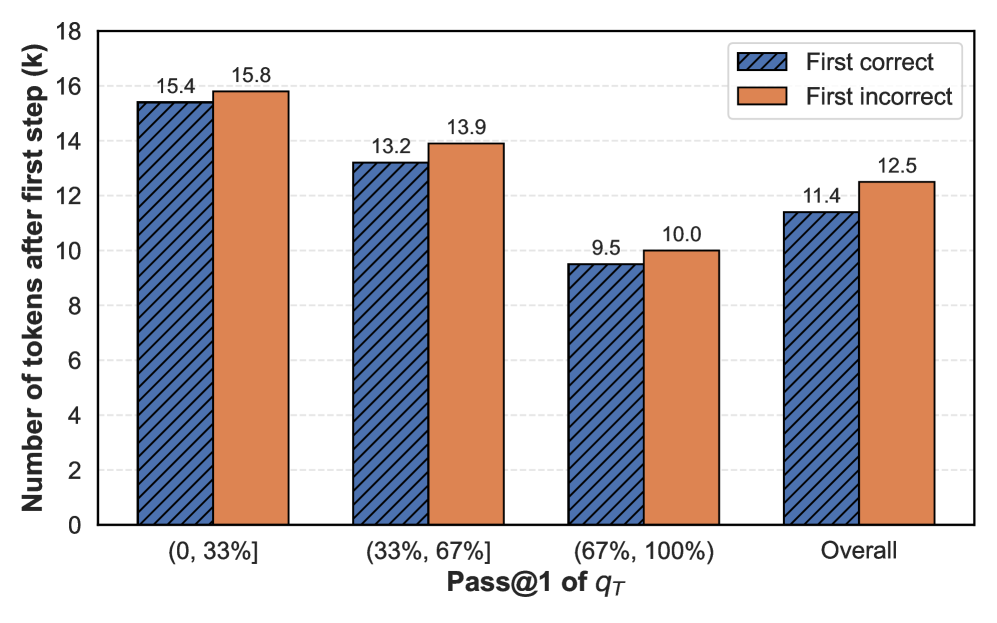
This bar chart compares the number of tokens generated after the first step for "First correct" and "First incorrect" predictions, categorized by the Pass@1 metric of qτ. The chart displays the data for three qτ ranges: (0, 33%], (33%, 67%], and (67%, 100%], as well as an overall average.
### Components/Axes
* **X-axis:** Pass@1 of qτ, with categories: (0, 33%], (33%, 67%], (67%, 100%], and "Overall".
* **Y-axis:** Number of tokens after first step (k), ranging from 0 to 18, with increments of 2.
* **Legend:** Located in the top-right corner.
* "First correct" - represented by a blue, diagonally-striped bar.
* "First incorrect" - represented by an orange, diagonally-striped bar.
### Detailed Analysis
The chart consists of four groups of paired bars, one for each Pass@1 category and one for the overall average.
* **(0, 33%]**:
* "First correct": Approximately 15.4 k tokens.
* "First incorrect": Approximately 15.8 k tokens.
* **(33%, 67%]**:
* "First correct": Approximately 13.2 k tokens.
* "First incorrect": Approximately 13.9 k tokens.
* **(67%, 100%]**:
* "First correct": Approximately 9.5 k tokens.
* "First incorrect": Approximately 10.0 k tokens.
* **Overall**:
* "First correct": Approximately 11.4 k tokens.
* "First incorrect": Approximately 12.5 k tokens.
The "First incorrect" bars are consistently higher than the "First correct" bars across all categories, though the difference varies.
### Key Observations
* The number of tokens generated after the first step decreases as the Pass@1 of qτ increases for both "First correct" and "First incorrect" predictions.
* The difference between "First correct" and "First incorrect" is most pronounced in the (0, 33%] category, with "First incorrect" being slightly higher.
* The overall "First incorrect" value (12.5 k) is higher than the overall "First correct" value (11.4 k).
### Interpretation
The data suggests that when the model's initial prediction is incorrect (as indicated by a lower Pass@1 score), it tends to generate more tokens in the subsequent step. This could indicate that the model attempts to "recover" from an incorrect initial prediction by generating more text. The decreasing number of tokens as Pass@1 increases suggests that more accurate initial predictions require less subsequent generation. The overall trend confirms that, on average, incorrect first steps lead to more tokens being generated. This could be a useful metric for evaluating and improving the model's prediction accuracy and efficiency. The chart demonstrates a clear inverse relationship between initial prediction accuracy (Pass@1) and the amount of text generated after the first step.