## Grouped Bar Chart: Token Count After First Step by Pass@1 Performance
### Overview
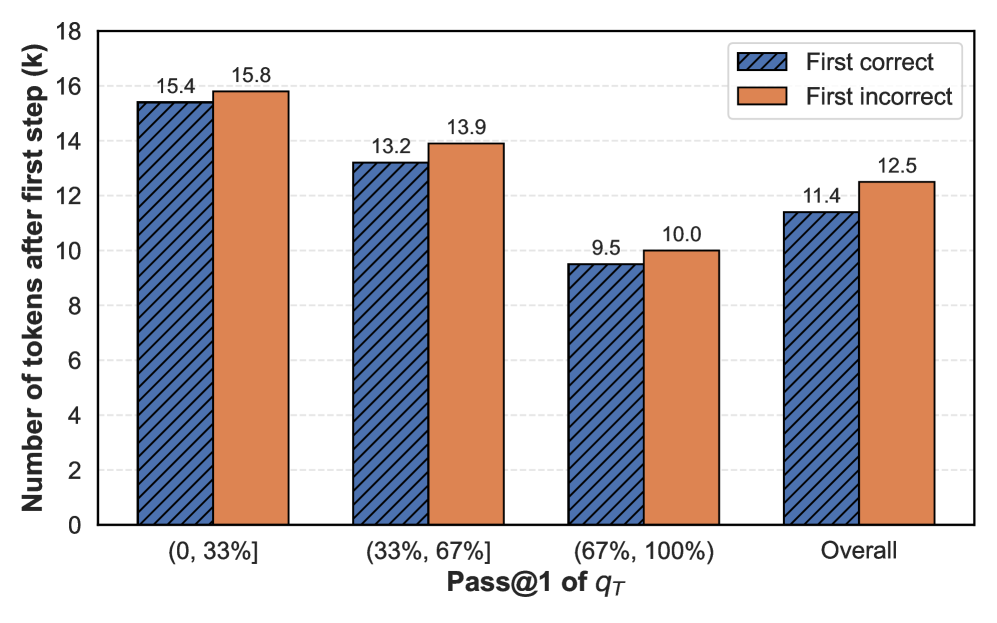
This is a grouped bar chart comparing the average number of tokens generated after the first step (in thousands, denoted as 'k') for two conditions: "First correct" and "First incorrect" responses. The data is segmented into four categories based on the Pass@1 metric of a variable denoted as `q_T`. The chart illustrates how the token count varies with the model's initial performance.
### Components/Axes
* **Chart Type:** Grouped Bar Chart.
* **Y-Axis:** Labeled "Number of tokens after first step (k)". The scale runs from 0 to 18, with major tick marks every 2 units (0, 2, 4, ..., 18).
* **X-Axis:** Labeled "Pass@1 of `q_T`". It contains four categorical groups:
1. `(0, 33%]`
2. `(33%, 67%]`
3. `(67%, 100%)`
4. `Overall`
* **Legend:** Positioned in the top-right corner of the chart area.
* **First correct:** Represented by blue bars with diagonal hatching (\\).
* **First incorrect:** Represented by solid orange bars.
* **Data Labels:** The exact numerical value (in thousands) is printed above each bar.
### Detailed Analysis
The chart presents the following data points for each category:
**1. Category: (0, 33%]**
* **First correct (Blue, Hatched):** 15.4k tokens.
* **First incorrect (Orange, Solid):** 15.8k tokens.
* *Trend:* Both values are the highest in the chart. The "First incorrect" bar is slightly taller than the "First correct" bar.
**2. Category: (33%, 67%]**
* **First correct (Blue, Hatched):** 13.2k tokens.
* **First incorrect (Orange, Solid):** 13.9k tokens.
* *Trend:* Both values are lower than in the (0, 33%] category. The "First incorrect" bar remains taller than the "First correct" bar.
**3. Category: (67%, 100%)**
* **First correct (Blue, Hatched):** 9.5k tokens.
* **First incorrect (Orange, Solid):** 10.0k tokens.
* *Trend:* This category has the lowest token counts in the chart. The "First incorrect" bar is still taller than the "First correct" bar.
**4. Category: Overall**
* **First correct (Blue, Hatched):** 11.4k tokens.
* **First incorrect (Orange, Solid):** 12.5k tokens.
* *Trend:* This represents the aggregate average. The "First incorrect" bar is taller than the "First correct" bar.
### Key Observations
* **Consistent Pattern:** In every single category—across all performance brackets and the overall average—the "First incorrect" condition results in a higher average number of tokens after the first step than the "First correct" condition.
* **Inverse Relationship with Performance:** There is a clear inverse relationship between the Pass@1 performance bracket and the token count. As the Pass@1 score increases (moving from left to right on the x-axis), the number of tokens after the first step decreases for both "correct" and "incorrect" conditions.
* **Magnitude of Difference:** The gap between "incorrect" and "correct" token counts is relatively consistent, ranging from approximately 0.4k to 1.1k tokens across the categories.
* **Lowest Resource Usage:** The (67%, 100%) performance bracket shows the most efficient (lowest) token usage after the first step for both conditions.
### Interpretation
The data suggests a strong correlation between a model's initial correctness and its subsequent computational efficiency (measured by token generation).
* **Efficiency of Correctness:** When a model's first step is correct, it tends to generate fewer tokens to complete the task. This implies that a correct initial reasoning step sets a more efficient, direct path to the solution, requiring less subsequent exploration or correction.
* **Cost of Errors:** An incorrect first step is associated with generating more tokens. This likely reflects the model needing to engage in more extensive "backtracking," self-correction, or alternative path exploration to recover from the initial error, thereby consuming more resources.
* **Performance Bracket Insight:** The decreasing token count with higher Pass@1 scores indicates that models or tasks where the model is more likely to be correct on the first try are also inherently less token-intensive. This could be because these are simpler tasks, or because the model's stronger performance allows for more concise reasoning.
* **Overall Implication:** The chart provides quantitative evidence that the quality of the initial reasoning step is a critical determinant of overall efficiency. Encouraging or ensuring correct first steps could lead to significant reductions in computational cost (token usage) for language model inference. The consistent pattern across all brackets reinforces the robustness of this relationship.