## Line Chart: Throughput vs Batch Size
### Overview
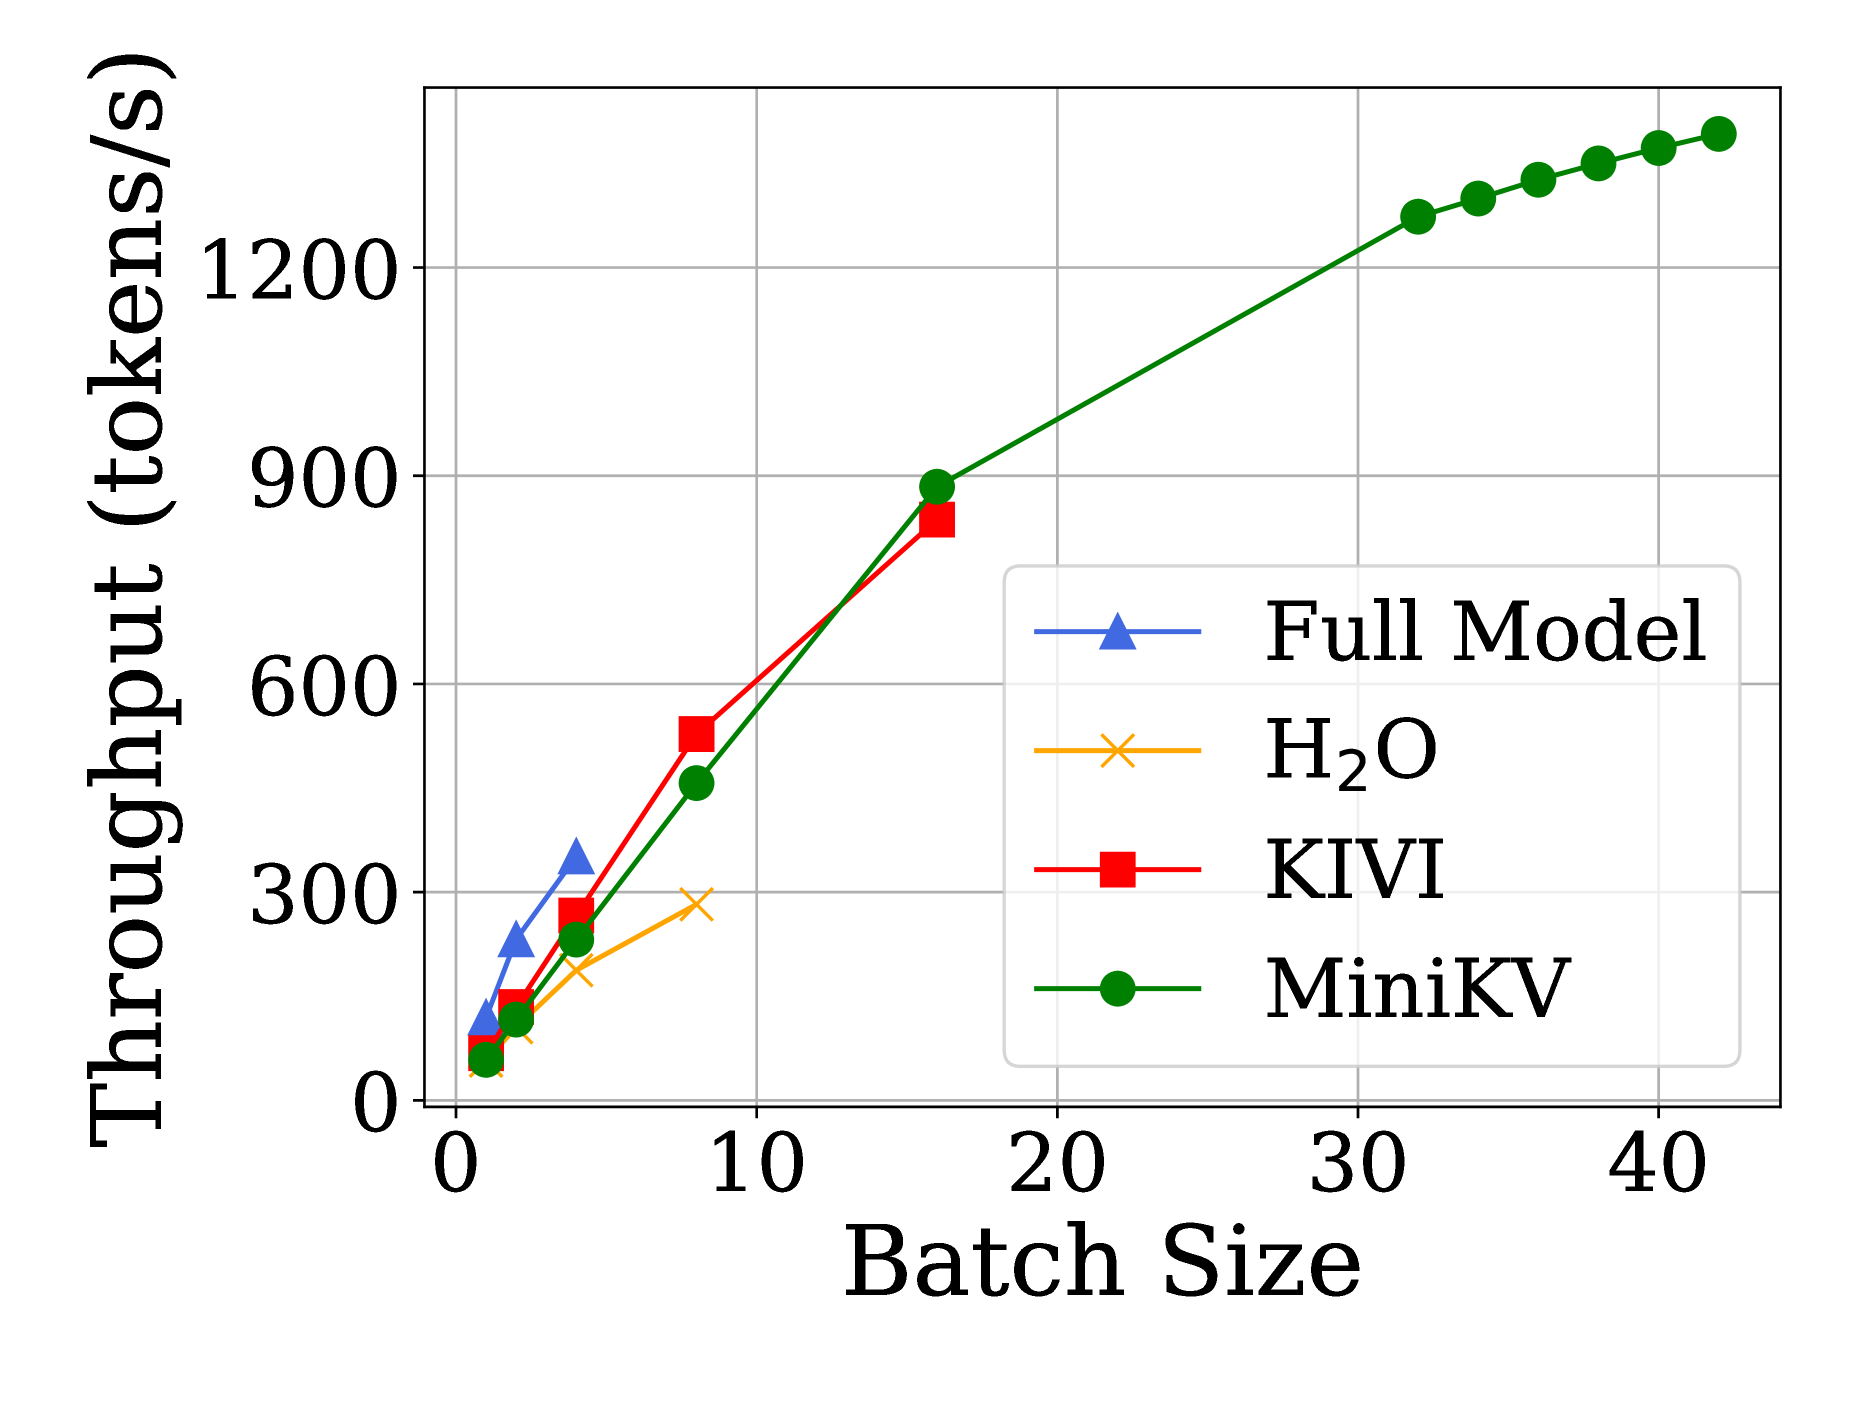
The chart compares the throughput (tokens per second) of four different models (Full Model, H₂O, KIVI, MiniKV) across varying batch sizes (0 to 40). Throughput increases with batch size for all models, but the rate of improvement and final performance differ significantly.
### Components/Axes
- **X-axis (Batch Size)**: Ranges from 0 to 40 in increments of 10.
- **Y-axis (Throughput)**: Ranges from 0 to 1400 tokens/s in increments of 300.
- **Legend**:
- Blue triangles: Full Model
- Orange crosses: H₂O
- Red squares: KIVI
- Green circles: MiniKV
- **Data Points**: Each model is represented by a distinct marker and line style.
### Detailed Analysis
1. **Full Model (Blue Triangles)**:
- Starts at ~50 tokens/s (batch size 1).
- Reaches ~300 tokens/s at batch size 10.
- No data points beyond batch size 10.
2. **H₂O (Orange Crosses)**:
- Starts at ~20 tokens/s (batch size 1).
- Reaches ~300 tokens/s at batch size 10.
- No data points beyond batch size 10.
3. **KIVI (Red Squares)**:
- Starts at ~10 tokens/s (batch size 1).
- Reaches ~800 tokens/s at batch size 15.
- No data points beyond batch size 15.
4. **MiniKV (Green Circles)**:
- Starts at ~5 tokens/s (batch size 1).
- Reaches ~1300 tokens/s at batch size 40.
- Shows the steepest slope, indicating the highest scalability.
### Key Observations
- **MiniKV** consistently outperforms other models at larger batch sizes (e.g., 1300 tokens/s at batch size 40 vs. 800 tokens/s for KIVI at batch size 15).
- **H₂O** and **Full Model** have similar performance but plateau at lower throughputs (~300 tokens/s) compared to KIVI and MiniKV.
- All models show diminishing returns at smaller batch sizes (e.g., batch size 1–5).
### Interpretation
The data suggests that **MiniKV** is the most scalable model for high-throughput applications, particularly when processing large batch sizes. Its linear growth trend indicates efficient resource utilization. In contrast, **H₂O** and **Full Model** underperform at larger batches, while **KIVI** offers moderate scalability but lags behind MiniKV. This highlights the importance of model architecture optimization for batch processing efficiency. The absence of data beyond certain batch sizes for some models may indicate hardware or implementation limitations.