## Line Chart: Pass@k (%) vs. k
### Overview
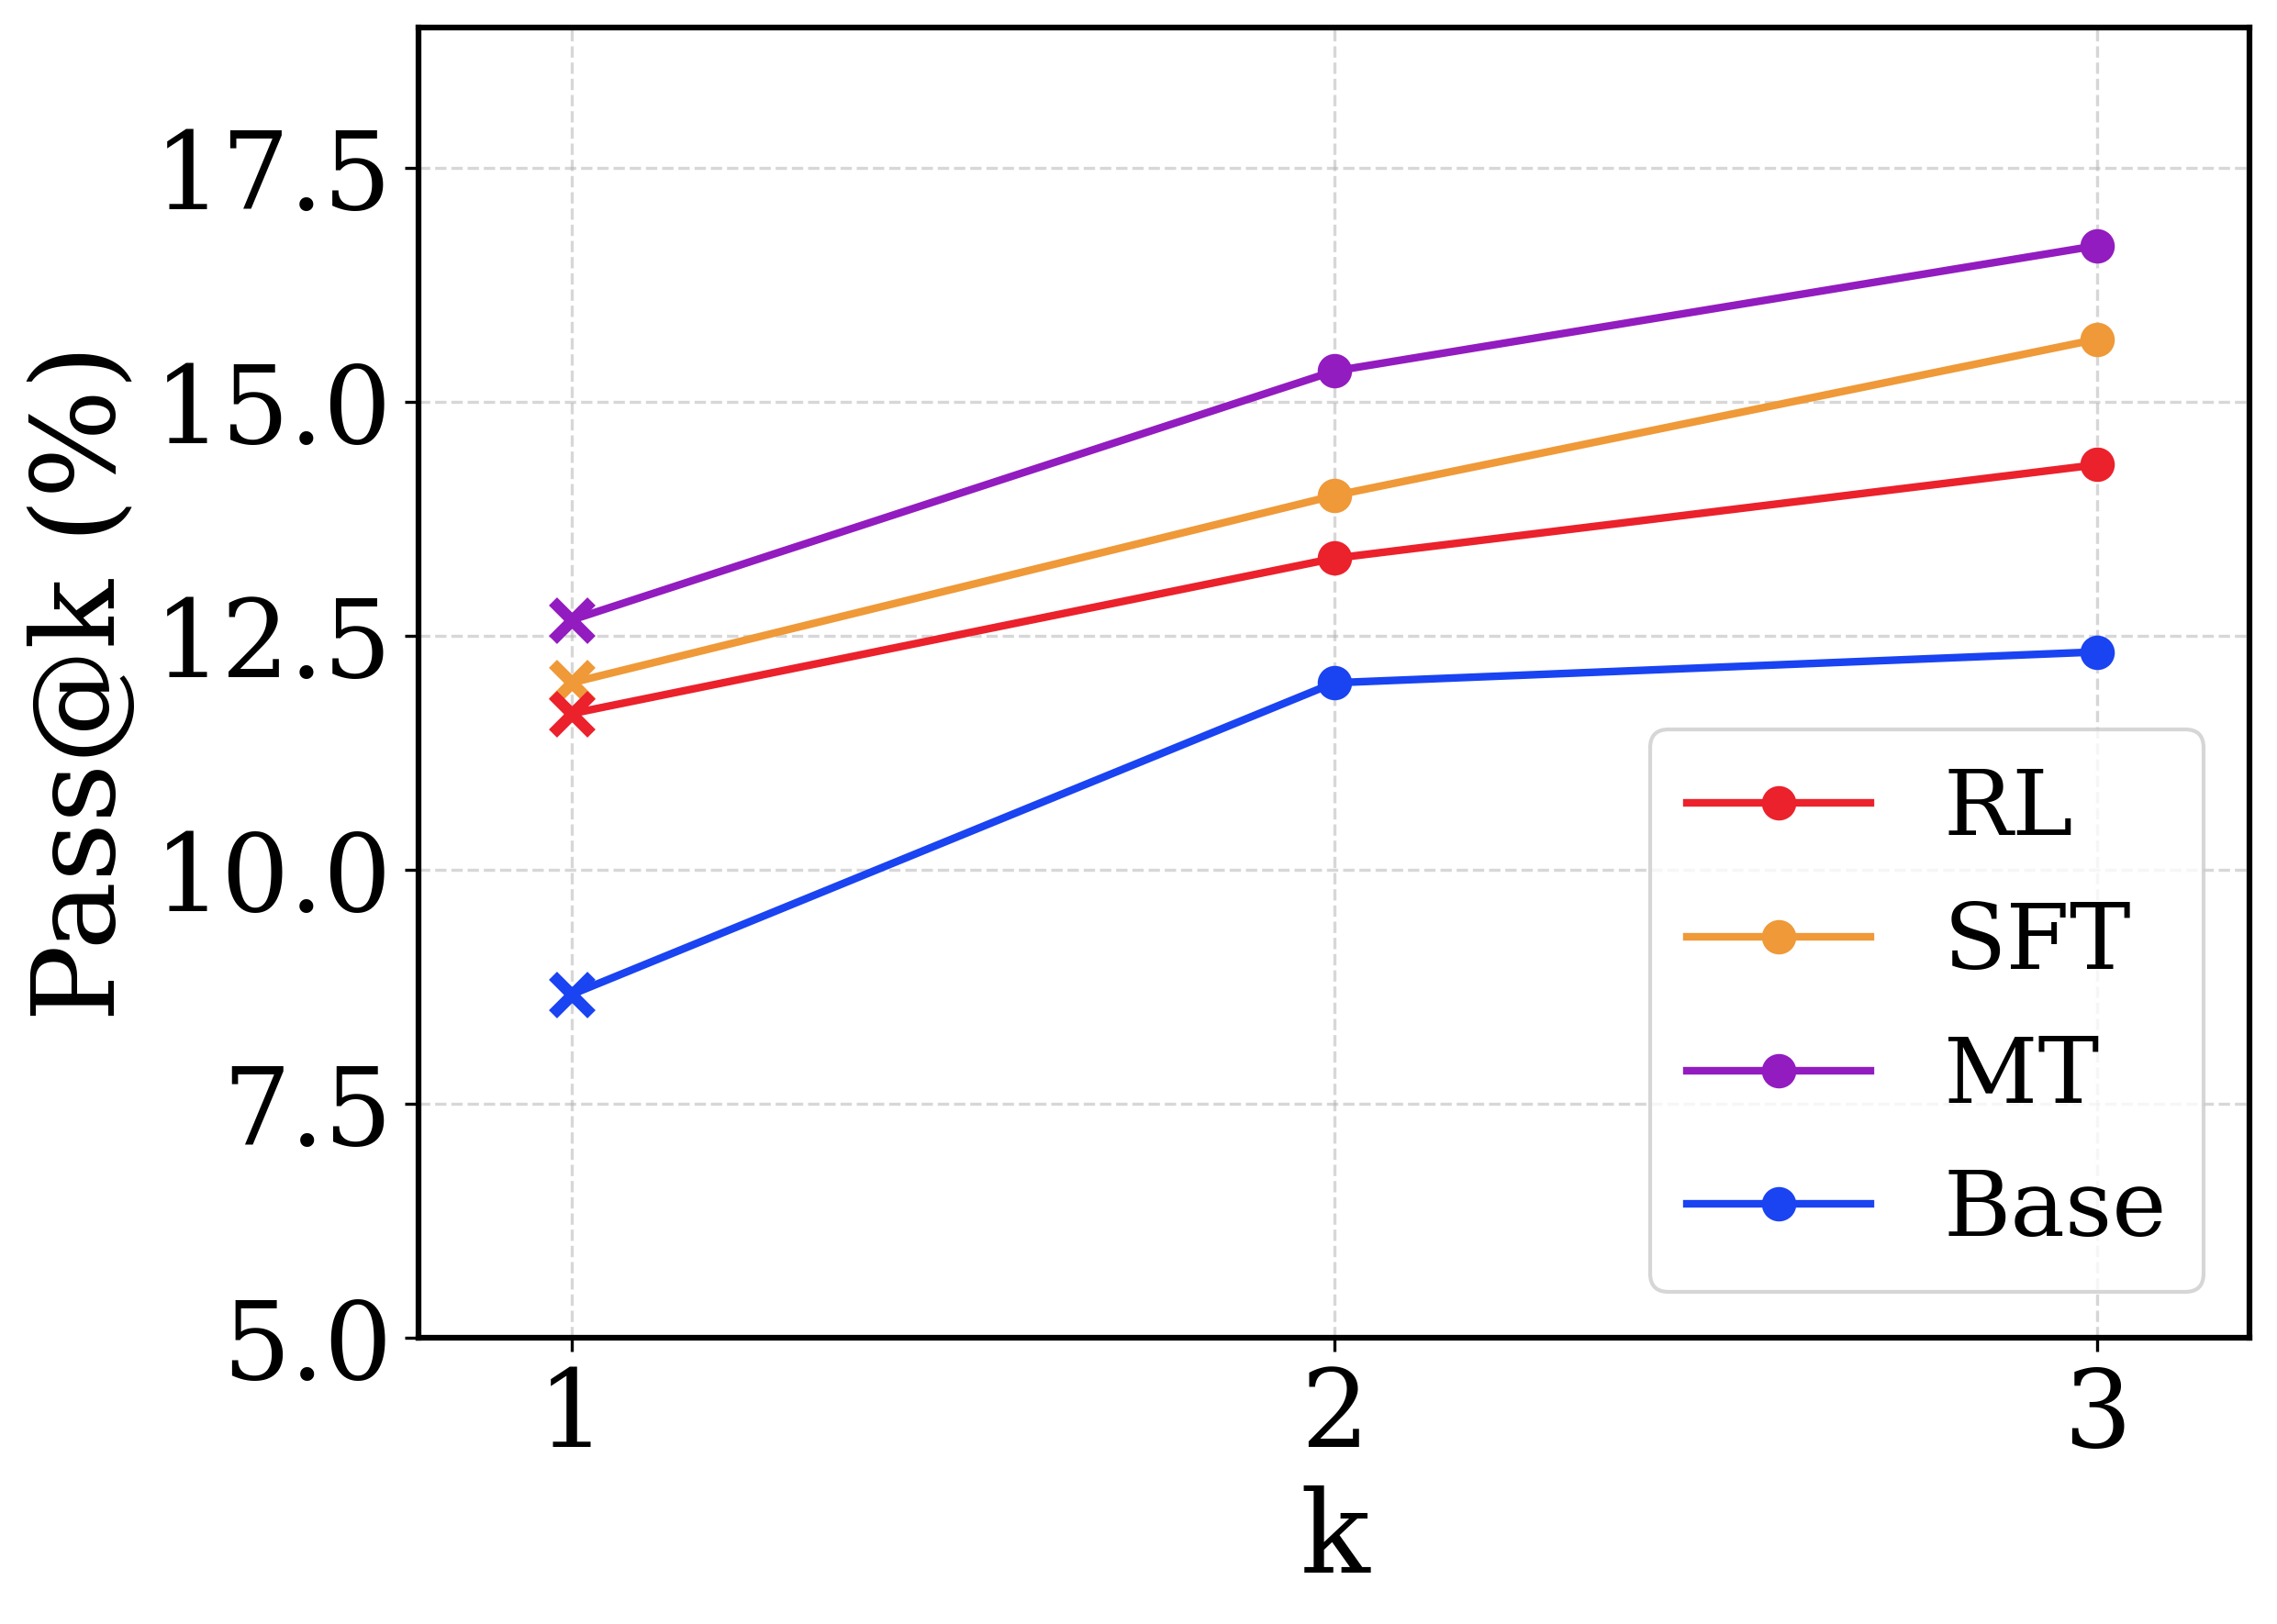
The image is a line chart comparing the performance of four different models (RL, SFT, MT, and Base) based on the "Pass@k (%)" metric for varying values of 'k' (1, 2, and 3). The chart displays how the performance of each model changes as 'k' increases.
### Components/Axes
* **X-axis:** 'k' (values: 1, 2, 3)
* **Y-axis:** Pass@k (%) (values: 5.0, 7.5, 10.0, 12.5, 15.0, 17.5)
* **Legend:** Located on the right side of the chart.
* Red line: RL
* Orange line: SFT
* Purple line: MT
* Blue line: Base
### Detailed Analysis
* **RL (Red):** The red line represents the RL model. It starts at approximately 11.7% at k=1, increases to about 13.3% at k=2, and reaches approximately 14.3% at k=3. The trend is upward, indicating improved performance with increasing 'k'.
* **SFT (Orange):** The orange line represents the SFT model. It starts at approximately 12.3% at k=1, increases to about 14.0% at k=2, and reaches approximately 15.7% at k=3. The trend is upward, indicating improved performance with increasing 'k'.
* **MT (Purple):** The purple line represents the MT model. It starts at approximately 12.7% at k=1, increases to about 15.3% at k=2, and reaches approximately 16.7% at k=3. The trend is upward, indicating improved performance with increasing 'k'.
* **Base (Blue):** The blue line represents the Base model. It starts at approximately 8.7% at k=1, increases to about 12.0% at k=2, and reaches approximately 12.3% at k=3. The trend is upward, indicating improved performance with increasing 'k'.
### Key Observations
* The MT model consistently outperforms the other models across all values of 'k'.
* The Base model has the lowest performance compared to the other models.
* All models show an increase in "Pass@k (%)" as 'k' increases from 1 to 3.
* The performance gap between the Base model and the other models narrows slightly as 'k' increases.
### Interpretation
The chart demonstrates that increasing the value of 'k' generally improves the "Pass@k (%)" metric for all models tested. The MT model exhibits the best performance, suggesting it is the most effective among the four models. The Base model's lower performance indicates it may benefit from further optimization or a different approach. The upward trends for all models suggest that allowing for more attempts ('k') leads to a higher probability of passing the evaluation criteria.