\n
## Line Chart: Pass@k vs. k for Different Models
### Overview
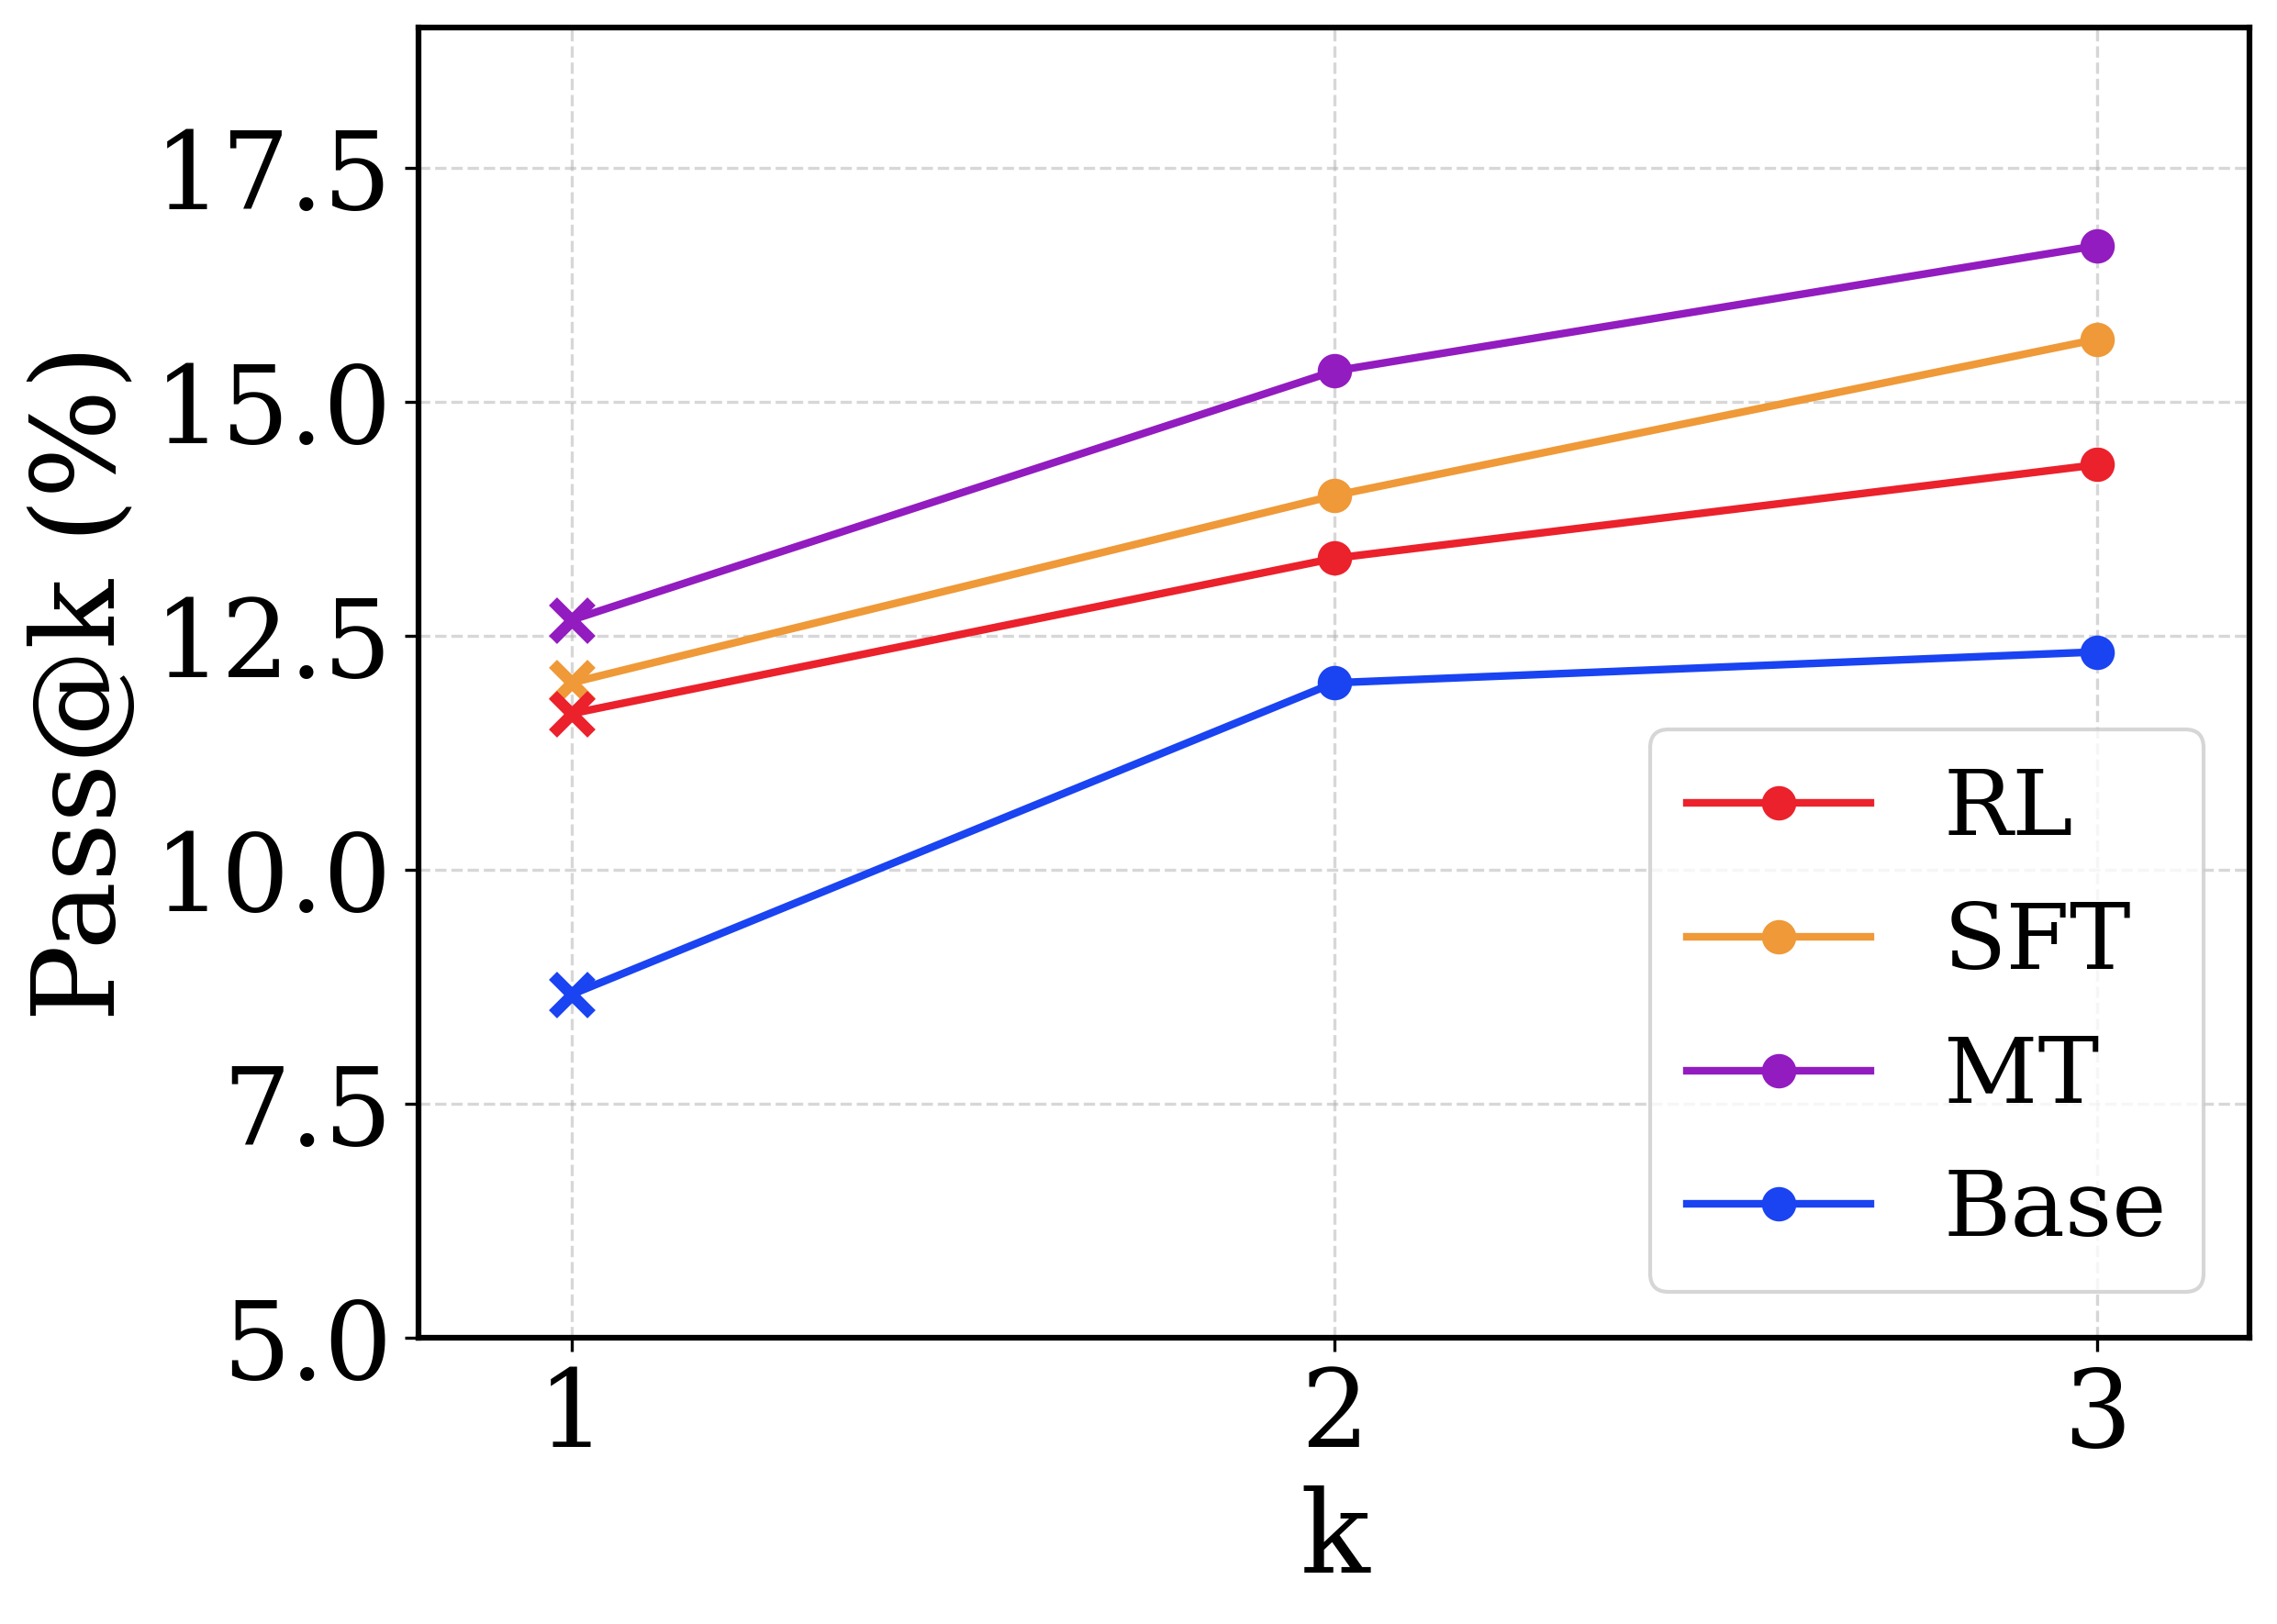
This image presents a line chart illustrating the relationship between the 'Pass@k' metric (expressed as a percentage) and the value of 'k' for four different models: RL, SFT, MT, and Base. The chart displays how the Pass@k performance changes as 'k' varies from 1 to 3.
### Components/Axes
* **X-axis:** Labeled "k", ranging from 1 to 3. The axis markers are 1, 2, and 3.
* **Y-axis:** Labeled "Pass@k (%)", ranging from 5.0 to 17.5. The axis markers are 5.0, 7.5, 10.0, 12.5, 15.0, and 17.5.
* **Legend:** Located in the top-right corner of the chart. It identifies the four data series:
* RL (Red)
* SFT (Orange)
* MT (Purple)
* Base (Blue)
### Detailed Analysis
* **RL (Red Line):** The red line shows a generally increasing trend.
* At k=1, Pass@k is approximately 11.5%.
* At k=2, Pass@k is approximately 13.75%.
* At k=3, Pass@k is approximately 14.25%.
* **SFT (Orange Line):** The orange line also shows an increasing trend, but is generally flatter than the RL line.
* At k=1, Pass@k is approximately 12.75%.
* At k=2, Pass@k is approximately 14.5%.
* At k=3, Pass@k is approximately 15.75%.
* **MT (Purple Line):** The purple line exhibits the steepest upward slope, indicating the most significant performance improvement with increasing 'k'.
* At k=1, Pass@k is approximately 14.75%.
* At k=2, Pass@k is approximately 15.75%.
* At k=3, Pass@k is approximately 16.75%.
* **Base (Blue Line):** The blue line shows a consistent, but relatively slow, increase in Pass@k.
* At k=1, Pass@k is approximately 8.5%.
* At k=2, Pass@k is approximately 11.25%.
* At k=3, Pass@k is approximately 12.25%.
### Key Observations
* The MT model consistently outperforms the other models across all values of 'k'.
* The Base model has the lowest Pass@k values at all 'k' values.
* The performance gains from increasing 'k' are most pronounced for the MT model.
* The RL and SFT models show similar performance, with SFT slightly outperforming RL at k=3.
### Interpretation
The chart demonstrates the impact of the 'k' parameter on the Pass@k metric for different models. The Pass@k metric likely represents the percentage of times the model achieves a successful outcome within the top 'k' predictions. The results suggest that increasing 'k' generally improves performance for all models, but the extent of improvement varies significantly. The MT model appears to benefit the most from increasing 'k', indicating that it is more sensitive to the number of considered predictions. The Base model's lower performance suggests it may require further optimization or a different architecture. The differences in performance between the models could be attributed to variations in their training data, model size, or training methodology (RL, SFT, MT). The chart provides valuable insights into the trade-offs between performance and the number of predictions considered, which can inform model selection and parameter tuning.