## Line Chart: Pass@k Performance Comparison
### Overview
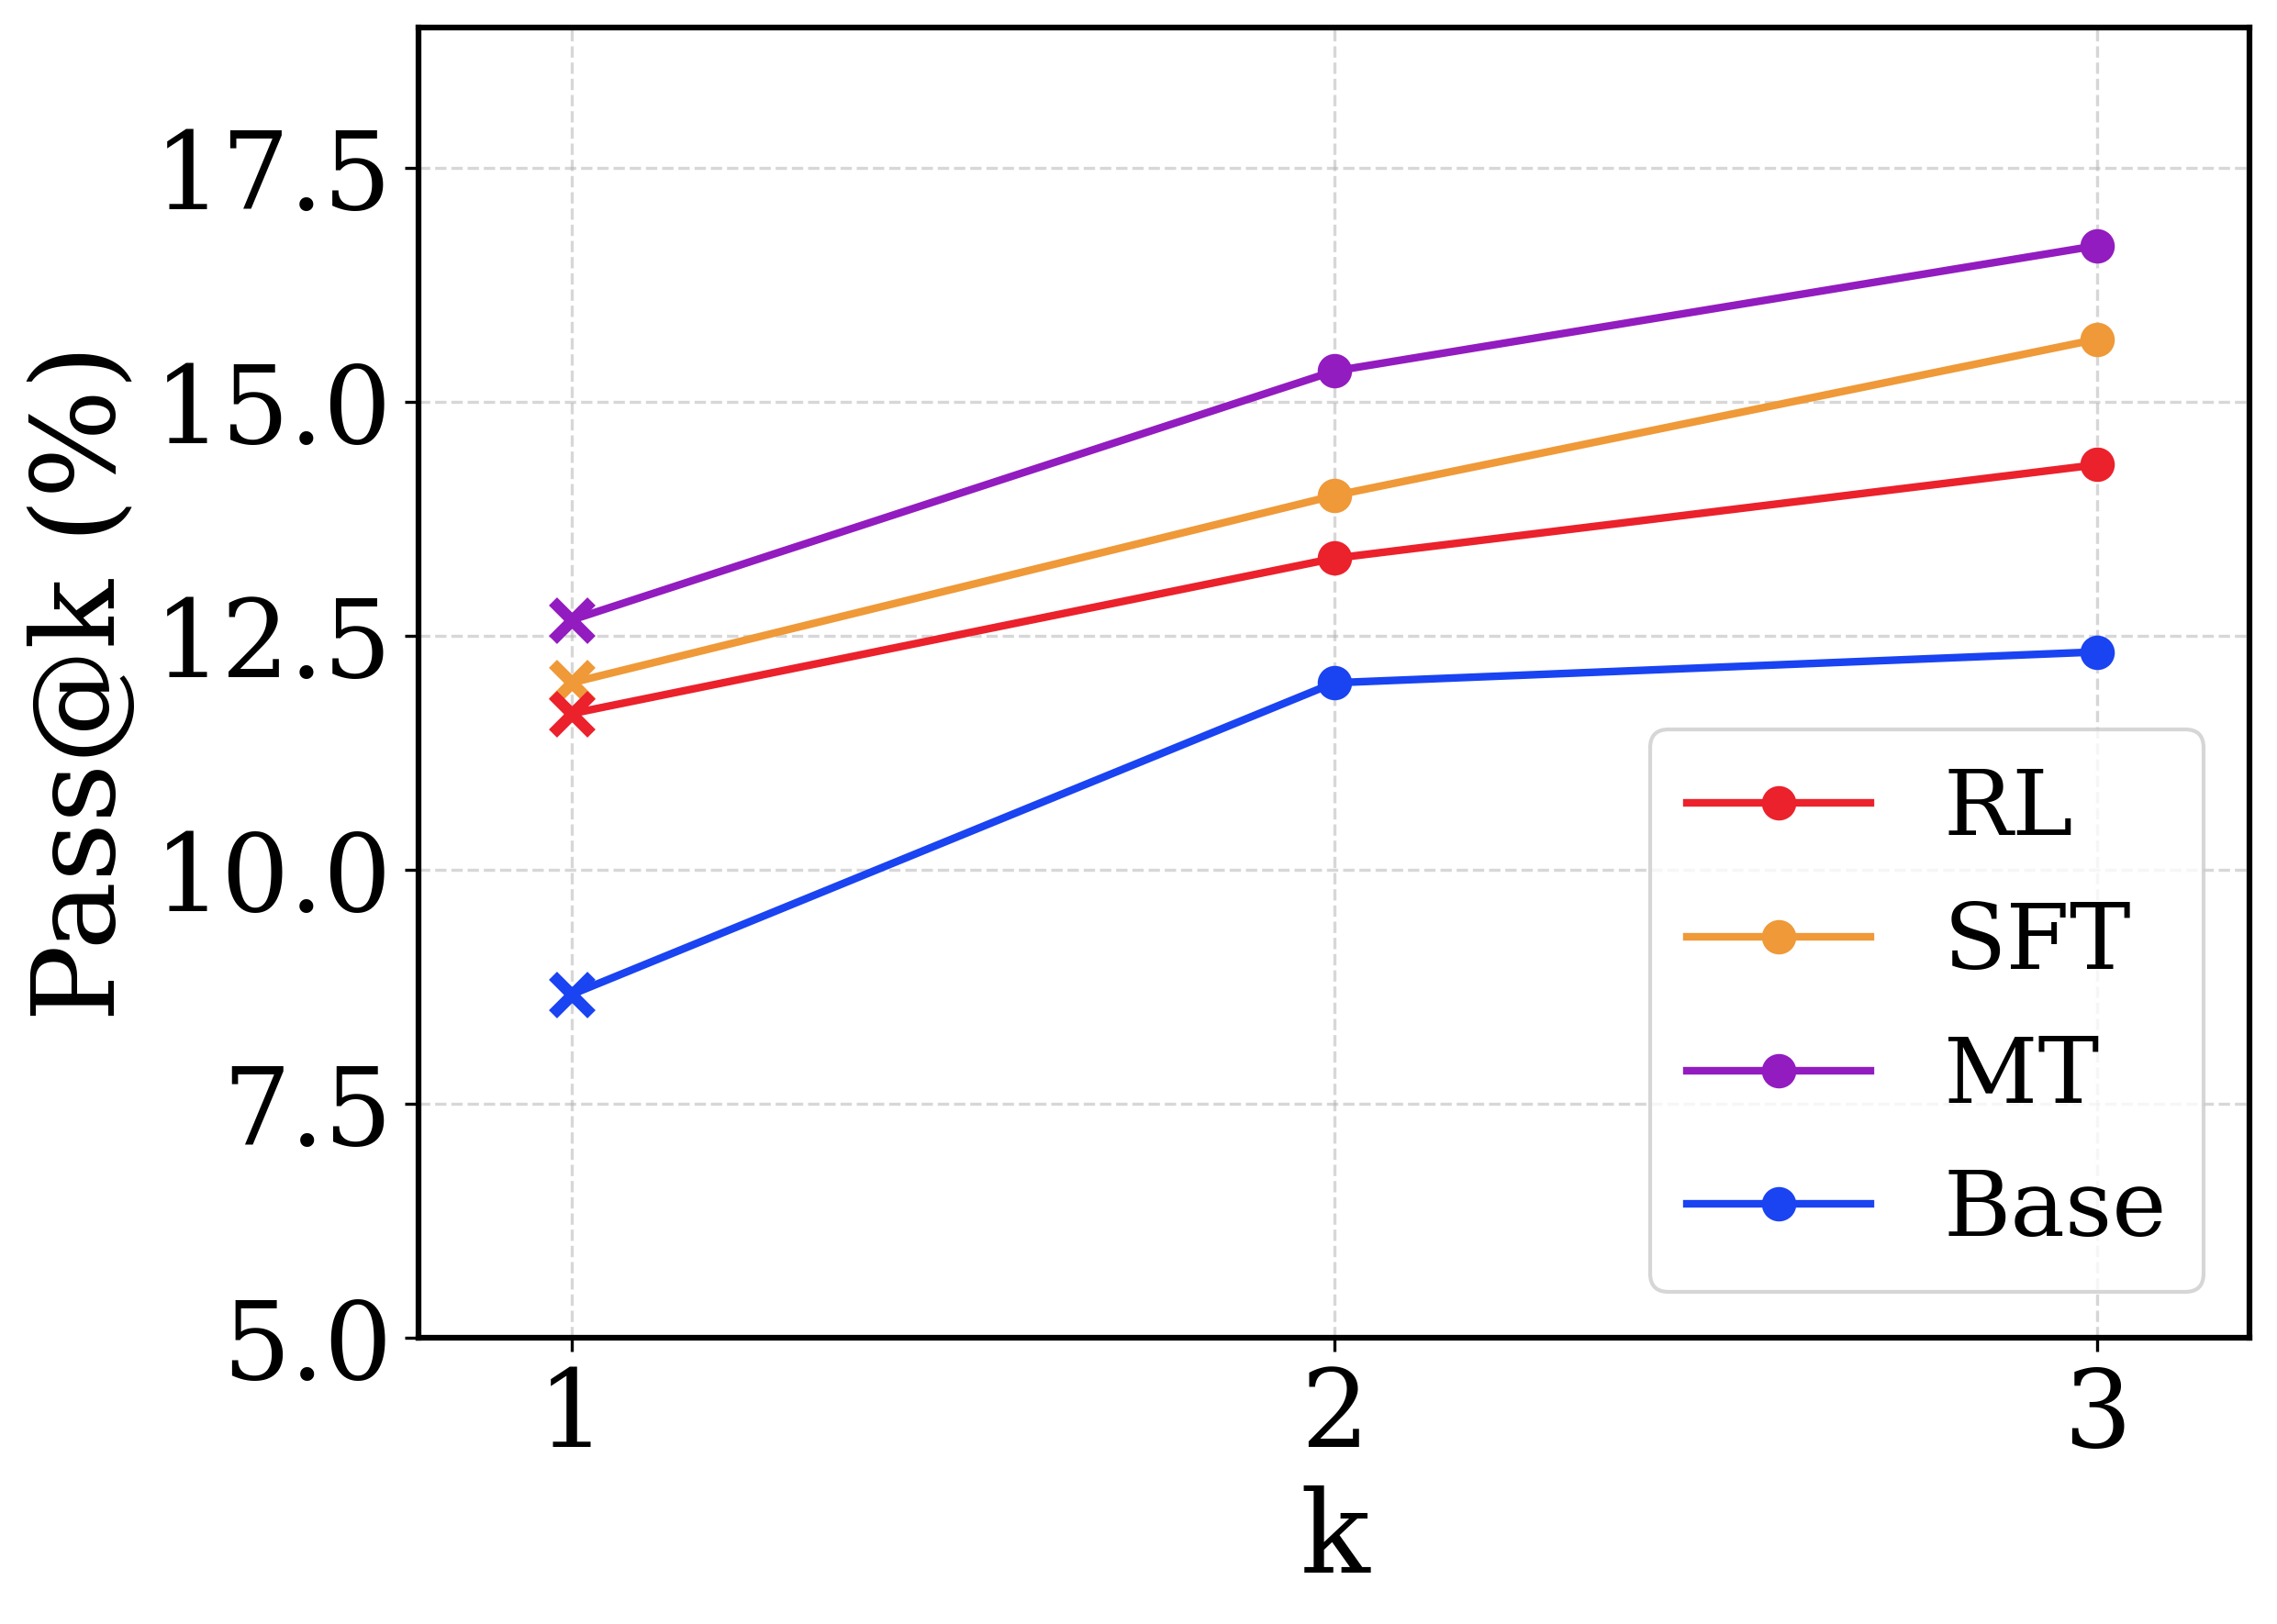
This image is a line chart comparing the performance of four different methods (RL, SFT, MT, Base) on a metric called "Pass@k" across three discrete values of k (1, 2, and 3). The chart shows how the success rate (in percentage) changes as the number of attempts (k) increases for each method.
### Components/Axes
* **X-axis:** Labeled "k". It has three discrete, evenly spaced markers: **1**, **2**, and **3**.
* **Y-axis:** Labeled "Pass@k (%)". It is a linear scale ranging from **5.0** to **17.5**, with major tick marks at 5.0, 7.5, 10.0, 12.5, 15.0, and 17.5.
* **Legend:** Located in the **bottom-right corner** of the plot area. It contains four entries, each with a colored line and marker:
* **RL:** Red line with circular markers.
* **SFT:** Orange line with circular markers.
* **MT:** Purple line with circular markers.
* **Base:** Blue line with circular markers.
* **Data Points:** For each method, data points are plotted at k=1, 2, and 3. The points at **k=1 are marked with an 'x'**, while the points at **k=2 and k=3 are marked with solid circles**.
### Detailed Analysis
The following table reconstructs the approximate data points for each method. Values are estimated from the chart's grid lines and carry inherent visual uncertainty.
| Method (Color) | k=1 (Pass@k %) | k=2 (Pass@k %) | k=3 (Pass@k %) | Visual Trend |
| :--- | :--- | :--- | :--- | :--- |
| **Base (Blue)** | ~8.5 | ~12.0 | ~12.2 | Sharp increase from k=1 to k=2, then nearly flat to k=3. |
| **RL (Red)** | ~11.5 | ~13.5 | ~14.5 | Steady, moderate upward slope across all k. |
| **SFT (Orange)** | ~12.0 | ~14.0 | ~15.5 | Steady, moderate upward slope, consistently above RL. |
| **MT (Purple)** | ~12.5 | ~15.5 | ~16.5 | Steep upward slope, consistently the highest-performing method. |
**Trend Verification:**
* **Base (Blue):** Slopes upward sharply from k=1 to k=2, then plateaus.
* **RL (Red):** Slopes upward steadily.
* **SFT (Orange):** Slopes upward steadily, parallel to but above RL.
* **MT (Purple):** Slopes upward steadily, with the steepest initial slope and highest final value.
### Key Observations
1. **Performance Hierarchy:** A clear and consistent performance hierarchy is maintained across all values of k: **MT > SFT > RL > Base**.
2. **Universal Improvement:** All four methods show an increase in Pass@k as k increases from 1 to 3, indicating that allowing more attempts improves the chance of success.
3. **Diminishing Returns for Base:** The "Base" method shows the most significant diminishing returns; its performance gain from k=2 to k=3 is negligible compared to the other methods.
4. **Consistent Gaps:** The performance gaps between the methods remain relatively constant. For example, MT maintains a lead of approximately 1-2 percentage points over SFT at each k value.
### Interpretation
The chart demonstrates the effectiveness of different training or prompting techniques (RL, SFT, MT) compared to a baseline ("Base") on a code generation or problem-solving task, as measured by the Pass@k metric.
* **What the data suggests:** The "MT" method is the most effective, followed by "SFT" and then "RL," with all three significantly outperforming the "Base" model. The fact that all methods improve with higher k is expected, as more samples increase the probability of generating a correct solution.
* **How elements relate:** The consistent ordering of the lines suggests that the advanced methods (MT, SFT, RL) provide a robust and scalable improvement over the base model. The plateau of the Base line might indicate a fundamental limitation in its capability that cannot be overcome simply by generating more samples.
* **Notable patterns:** The most notable pattern is the **parallel nature of the MT, SFT, and RL lines**. This suggests these methods might improve the model's underlying capability in a similar way, shifting the entire performance curve upward, whereas the Base model's curve has a different shape (sharper initial rise, quicker plateau). This could imply that the advanced methods not only improve the best-case performance (k=1) but also make the model more reliably correct as more attempts are allowed.