# Technical Document Extraction: Scatter Plot Analysis
## Legend and Labels
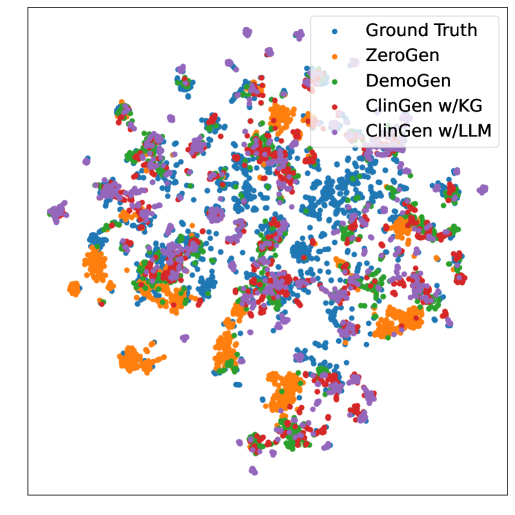
- **Legend Entries**:
- **Ground Truth**: Blue dots (reference dataset for comparison).
- **ZeroGen**: Orange dots.
- **DemoGen**: Green dots.
- **ClinGen w/KG**: Purple dots.
- **ClinGen w/LLM**: Red dots.
## Key Trends and Observations
1. **Clustering Patterns**:
- **ZeroGen** and **DemoGen** clusters are tightly grouped and closely overlap with the **Ground Truth** distribution, suggesting strong alignment with the reference data.
- **ClinGen w/KG** (purple) and **ClinGen w/LLM** (red) exhibit more dispersed distributions, indicating potential divergence from the Ground Truth compared to ZeroGen and DemoGen.
2. **Method Performance**:
- **ClinGen w/LLM** (red) shows the widest spread, potentially reflecting higher variability or lower precision in its generated data.
- **ZeroGen** (orange) and **DemoGen** (green) demonstrate the closest proximity to the Ground Truth, implying superior performance in mimicking the reference distribution.
## Axis and Structural Notes
- **No explicit axis titles or numerical markers** are visible in the provided image. The plot focuses solely on categorical clustering without quantitative axes.
- **No embedded text or data tables** are present beyond the legend.
## Cross-Reference Validation
- Colors in the legend are consistently matched to their respective clusters in the scatter plot:
- Blue (Ground Truth) serves as the reference point for all comparisons.
- Orange (ZeroGen), green (DemoGen), purple (ClinGen w/KG), and red (ClinGen w/LLM) are distinctly mapped to their clusters.
This analysis is derived solely from the visual distribution of colored dots and their alignment with the Ground Truth. No quantitative metrics (e.g., axis values, statistical summaries) are available due to the absence of labeled axes.