\n
## Scatter Plot: Timing vs. Guess (Byte 0)
### Overview
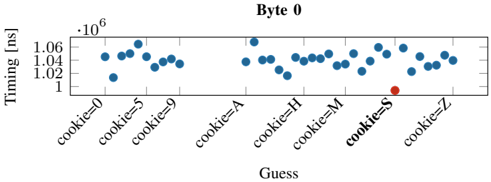
This image presents a scatter plot illustrating the relationship between a "Guess" value (representing potential cookie values) and "Timing" measured in nanoseconds (ns). The plot focuses on Byte 0 of a larger dataset, as indicated by the title "Byte 0". The data points appear to represent timing measurements associated with different guess values.
### Components/Axes
* **X-axis:** "Guess" - Categorical variable with the following values: "cookie=0", "cookie=5", "cookie=9", "cookie=A", "cookie=H", "cookie=M", "cookie=S", "cookie=Z".
* **Y-axis:** "Timing [ns]" - Numerical variable, ranging from approximately 1.00 x 10<sup>6</sup> ns to 1.07 x 10<sup>6</sup> ns.
* **Title:** "Byte 0" - Indicates the data pertains to the first byte.
* **Data Points:** Blue circles representing timing measurements for each guess value.
* **Outlier:** A single red circle at "cookie=S" with a timing of approximately 1.00 x 10<sup>6</sup> ns.
### Detailed Analysis
The scatter plot shows a relatively consistent timing value across most guess values. The majority of the blue data points cluster between approximately 1.02 x 10<sup>6</sup> ns and 1.06 x 10<sup>6</sup> ns.
Here's a breakdown of approximate timing values for each guess:
* **cookie=0:** Timing values range from approximately 1.02 x 10<sup>6</sup> ns to 1.05 x 10<sup>6</sup> ns.
* **cookie=5:** Timing values range from approximately 1.03 x 10<sup>6</sup> ns to 1.06 x 10<sup>6</sup> ns.
* **cookie=9:** Timing values range from approximately 1.03 x 10<sup>6</sup> ns to 1.06 x 10<sup>6</sup> ns.
* **cookie=A:** Timing values range from approximately 1.03 x 10<sup>6</sup> ns to 1.06 x 10<sup>6</sup> ns.
* **cookie=H:** Timing values range from approximately 1.03 x 10<sup>6</sup> ns to 1.06 x 10<sup>6</sup> ns.
* **cookie=M:** Timing values range from approximately 1.03 x 10<sup>6</sup> ns to 1.06 x 10<sup>6</sup> ns.
* **cookie=S:** Timing value is approximately 1.00 x 10<sup>6</sup> ns (red outlier).
* **cookie=Z:** Timing values range from approximately 1.03 x 10<sup>6</sup> ns to 1.05 x 10<sup>6</sup> ns.
### Key Observations
* The timing values are relatively stable across most guess values.
* The "cookie=S" guess exhibits a significantly lower timing value compared to all other guesses, and is highlighted in red. This is a clear outlier.
* There is no obvious linear trend or correlation between the guess value and the timing.
### Interpretation
The data suggests that the timing measurements are largely unaffected by the guessed cookie value, *except* for "cookie=S". The significantly lower timing for "cookie=S" indicates that this guess is likely the correct value, or at least a value that triggers a faster processing path. This could be due to a timing attack vulnerability where the system responds faster when the correct guess is made. The consistent timing for other guesses suggests that the system is designed to obfuscate the correct guess by introducing a constant delay. The outlier at "cookie=S" is a strong indicator of a potential security weakness. The plot demonstrates a timing difference that could be exploited to determine the correct cookie value. The fact that the data is presented for "Byte 0" suggests that this is part of a larger analysis of the entire cookie.