## Scatter Plot: Timing Analysis for Byte 0 Guesses
### Overview
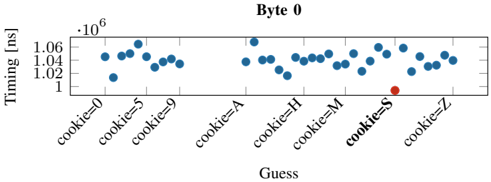
The image is a scatter plot chart titled "Byte 0". It displays timing measurements (in nanoseconds) for a series of guesses, likely related to a cryptographic or security timing attack analysis. The plot compares the timing response of a system to different input guesses, with one guess highlighted as an outlier.
### Components/Axes
* **Chart Title:** "Byte 0" (centered at the top).
* **Y-Axis:**
* **Label:** "Timing [ns]" (vertical text on the left).
* **Scale:** Linear scale with a multiplier of `·10^6` indicated at the top-left of the axis.
* **Markers:** Major tick marks at `1`, `1.02`, `1.04`, and `1.06`. These represent values of 1,000,000 ns, 1,020,000 ns, 1,040,000 ns, and 1,060,000 ns, respectively.
* **X-Axis:**
* **Label:** "Guess" (centered at the bottom).
* **Categories (from left to right):** `cookie=0`, `cookie=5`, `cookie=9`, `cookie=A`, `cookie=H`, `cookie=M`, `cookie=S`, `cookie=Z`. These are categorical labels, not a continuous scale.
* **Data Series:**
* **Blue Dots:** The primary data series, representing timing measurements for each guess. There are approximately 25-30 blue dots scattered across the plot.
* **Red Dot:** A single, distinct data point located at the x-axis position for `cookie=S`. It is positioned noticeably lower on the y-axis than the cluster of blue dots.
* **Legend:** No explicit legend box is present. The distinction between the blue and red data points is implied by their color and position.
### Detailed Analysis
* **Y-Axis (Timing) Distribution:** The vast majority of data points (blue dots) are clustered in a band between approximately `1.02` and `1.06` on the y-axis (1,020,000 ns to 1,060,000 ns). The distribution within this band appears relatively uniform, with no strong upward or downward trend across the x-axis categories.
* **X-Axis (Guess) Categories:** The guesses are discrete labels. The spacing between them on the axis is uniform, treating them as categorical data.
* **Outlier Identification:** The single red dot, corresponding to the guess `cookie=S`, is a clear outlier. Its y-axis value is approximately `1.0` (1,000,000 ns), which is significantly lower than the central cluster of blue dots. It is positioned at the bottom-right region of the main data cluster.
* **Trend Verification:** There is no discernible linear trend (upward or downward slope) across the sequence of guesses from `cookie=0` to `cookie=Z`. The blue dots form a horizontal cloud. The only notable visual feature is the isolated, lower-positioned red dot.
### Key Observations
1. **Significant Timing Anomaly:** The guess `cookie=S` produces a timing measurement that is roughly 20,000 to 60,000 nanoseconds (2-6%) faster than the typical response time for other guesses.
2. **Cluster Consistency:** The timing for all other guesses (`cookie=0,5,9,A,H,M,Z`) is consistent, forming a tight horizontal band. This suggests the system's response time is largely invariant to these specific incorrect inputs.
3. **Spatial Grounding:** The red outlier dot is located directly above the `cookie=S` label on the x-axis and is vertically aligned near the `1` tick mark on the y-axis, confirming its low value.
### Interpretation
This chart is highly indicative of a **timing side-channel attack** analysis. In such attacks, an adversary measures the time a system takes to process different inputs to infer secret information.
* **What the data suggests:** The consistent, higher timing for most guesses represents the baseline processing time for an incorrect value. The significantly lower timing for `cookie=S` strongly suggests that this guess is **correct** or partially correct. Many cryptographic algorithms (e.g., byte-by-byte comparison in MAC verification or password checking) have an early-exit optimization: they return a failure as soon as a mismatch is found. A correct first byte (`S` in this case) allows the comparison to proceed further or complete faster, resulting in a measurable reduction in execution time.
* **How elements relate:** The x-axis represents the attacker's hypotheses for the value of "Byte 0". The y-axis is the side-channel signal (time). The outlier's position directly links the hypothesis `cookie=S` to the anomalous, faster timing signal.
* **Notable implications:** This plot provides empirical evidence that the system under test is vulnerable to a timing attack. The data allows an attacker to distinguish the correct byte value (`S`) from incorrect ones with high confidence. The lack of trend across other guesses indicates the attack is likely feasible for each byte position independently. The uncertainty in exact y-values (estimated from the plot) does not undermine the clear categorical conclusion: `cookie=S` is the outlier.