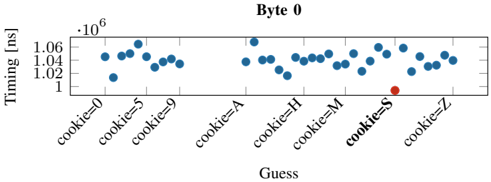
## Heatmap: Byte 0
### Overview
The heatmap displays the timing measurements in nanoseconds (ns) for different cookies at byte 0. The x-axis represents the cookies, and the y-axis represents the timing measurements.
### Components/Axes
- **X-axis**: Labeled with different cookies (cookie=0, cookie=5, cookie=9, cookie=A, cookie=M, cookie=S, cookie=Z).
- **Y-axis**: Labeled with timing measurements in nanoseconds (ns).
- **Legend**: Located at the top right corner, indicating the color coding for the cookies.
- **Title**: "Byte 0" at the top center of the heatmap.
### Detailed Analysis or ### Content Details
The heatmap shows a range of timing measurements for each cookie. The timing measurements vary, with some cookies having higher values than others. The legend indicates that the colors represent different cookies, with red representing cookie=S and blue representing the rest.
### Key Observations
- **Cookie=S**: Has a significantly higher timing measurement compared to the other cookies.
- **Cookie=Z**: Has a lower timing measurement compared to the other cookies.
- **Trend**: There is no clear trend in the timing measurements across the cookies.
### Interpretation
The heatmap suggests that the timing measurements for different cookies at byte 0 vary significantly. The cookie=S has a much higher timing measurement, which could indicate that it takes longer to process or access this cookie compared to the other cookies. The cookie=Z has a lower timing measurement, which could indicate that it is faster to process or access this cookie. The other cookies have similar timing measurements, suggesting that they are processed or accessed at a similar rate.