\n
## Bar Chart: Overlap Ratio vs. Percentage
### Overview
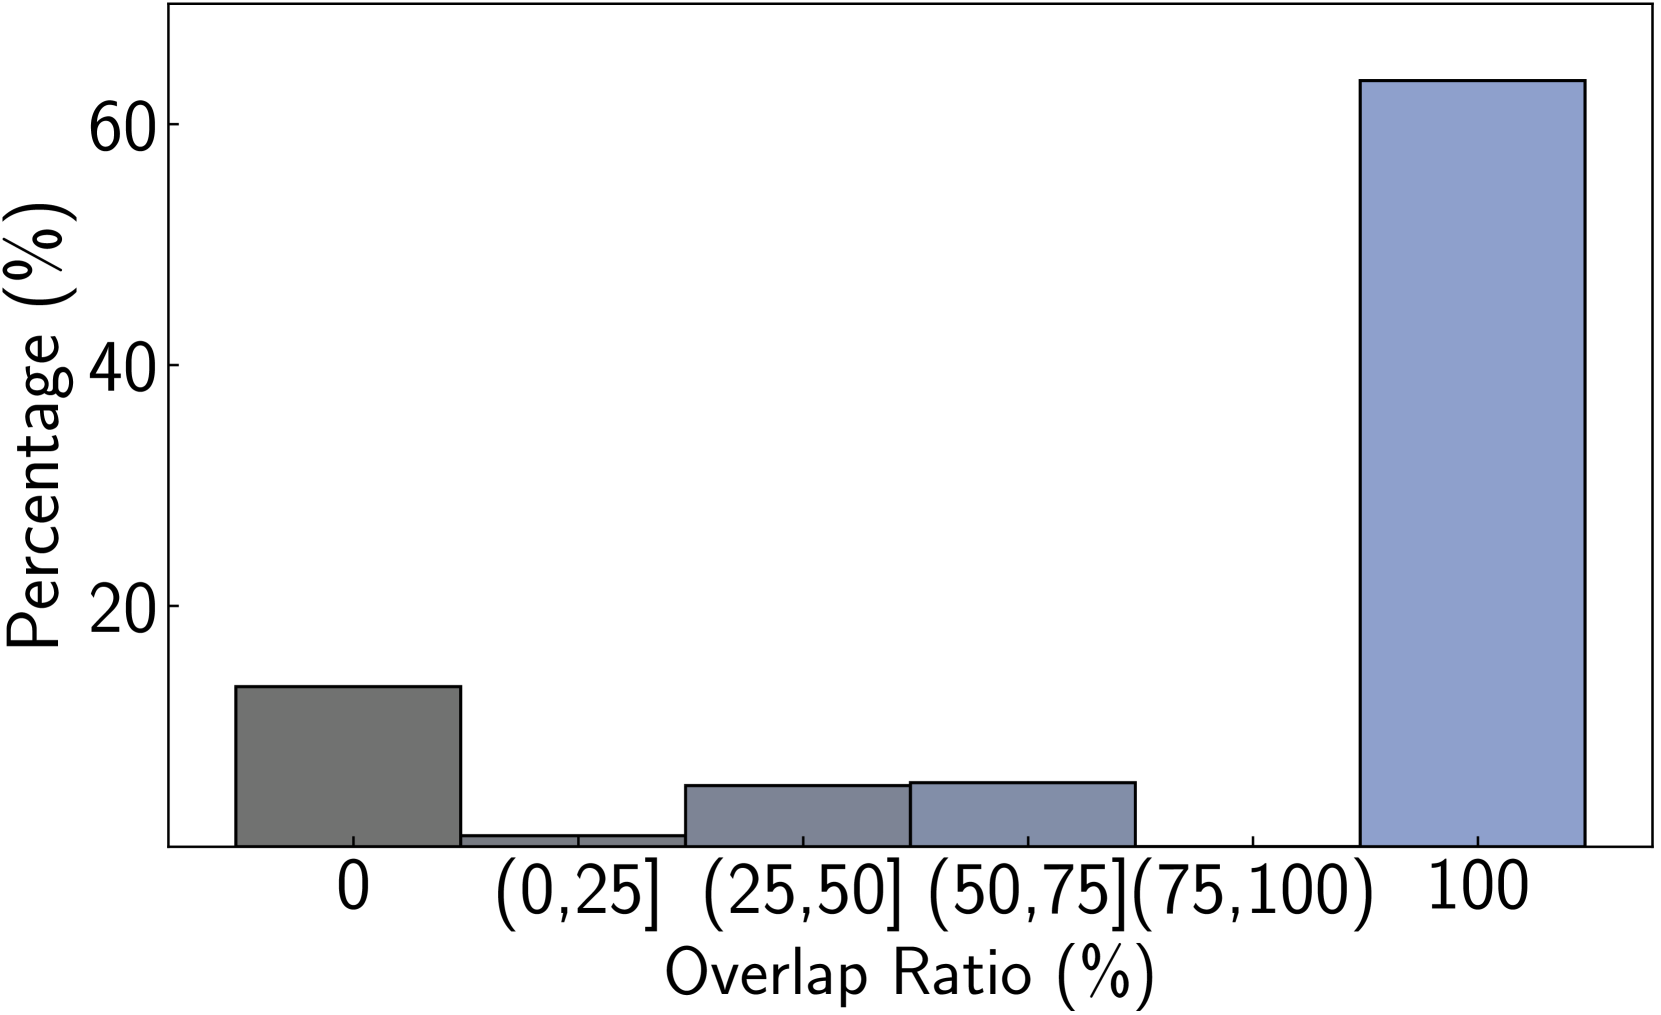
This is a bar chart illustrating the distribution of percentages based on overlap ratio. The x-axis represents the overlap ratio in percentage ranges, and the y-axis represents the corresponding percentage.
### Components/Axes
* **X-axis Title:** Overlap Ratio (%)
* **Y-axis Title:** Percentage (%)
* **X-axis Markers:** 0, (0,25], (25,50], (50,75], (75,100], 100
* **Bar Colors:** Grey, Light Blue
### Detailed Analysis
The chart displays six bars, each representing a different overlap ratio range.
* **Bar 1 (Overlap Ratio: 0):** The bar is grey and reaches approximately 14% on the y-axis.
* **Bar 2 (Overlap Ratio: (0,25]):** The bar is light blue and reaches approximately 4% on the y-axis.
* **Bar 3 (Overlap Ratio: (25,50]):** The bar is light blue and reaches approximately 6% on the y-axis.
* **Bar 4 (Overlap Ratio: (50,75]):** The bar is light blue and reaches approximately 8% on the y-axis.
* **Bar 5 (Overlap Ratio: (75,100]):** The bar is light blue and reaches approximately 10% on the y-axis.
* **Bar 6 (Overlap Ratio: 100):** The bar is light blue and reaches approximately 62% on the y-axis.
### Key Observations
The distribution is heavily skewed towards a 100% overlap ratio. The percentage decreases significantly as the overlap ratio decreases, with the highest percentage observed at 100% and the second highest at 0%. The bars representing overlap ratios between (0,25] and (75,100] have relatively low percentages.
### Interpretation
The data suggests that the majority of instances exhibit a complete overlap (100% overlap ratio). This could indicate a high degree of consistency or alignment in the data being analyzed. The significant drop in percentage as the overlap ratio decreases suggests that partial overlaps are less common. The initial bar at 0% overlap ratio indicates that there are some instances with no overlap at all, but these are far less frequent than instances with complete overlap. This chart could be representing the results of an image recognition task, where the overlap ratio represents the Intersection over Union (IoU) between predicted and ground truth bounding boxes. A high percentage at 100% IoU would indicate high accuracy in the image recognition task.