## Bar Chart: Overlap Ratio Distribution
### Overview
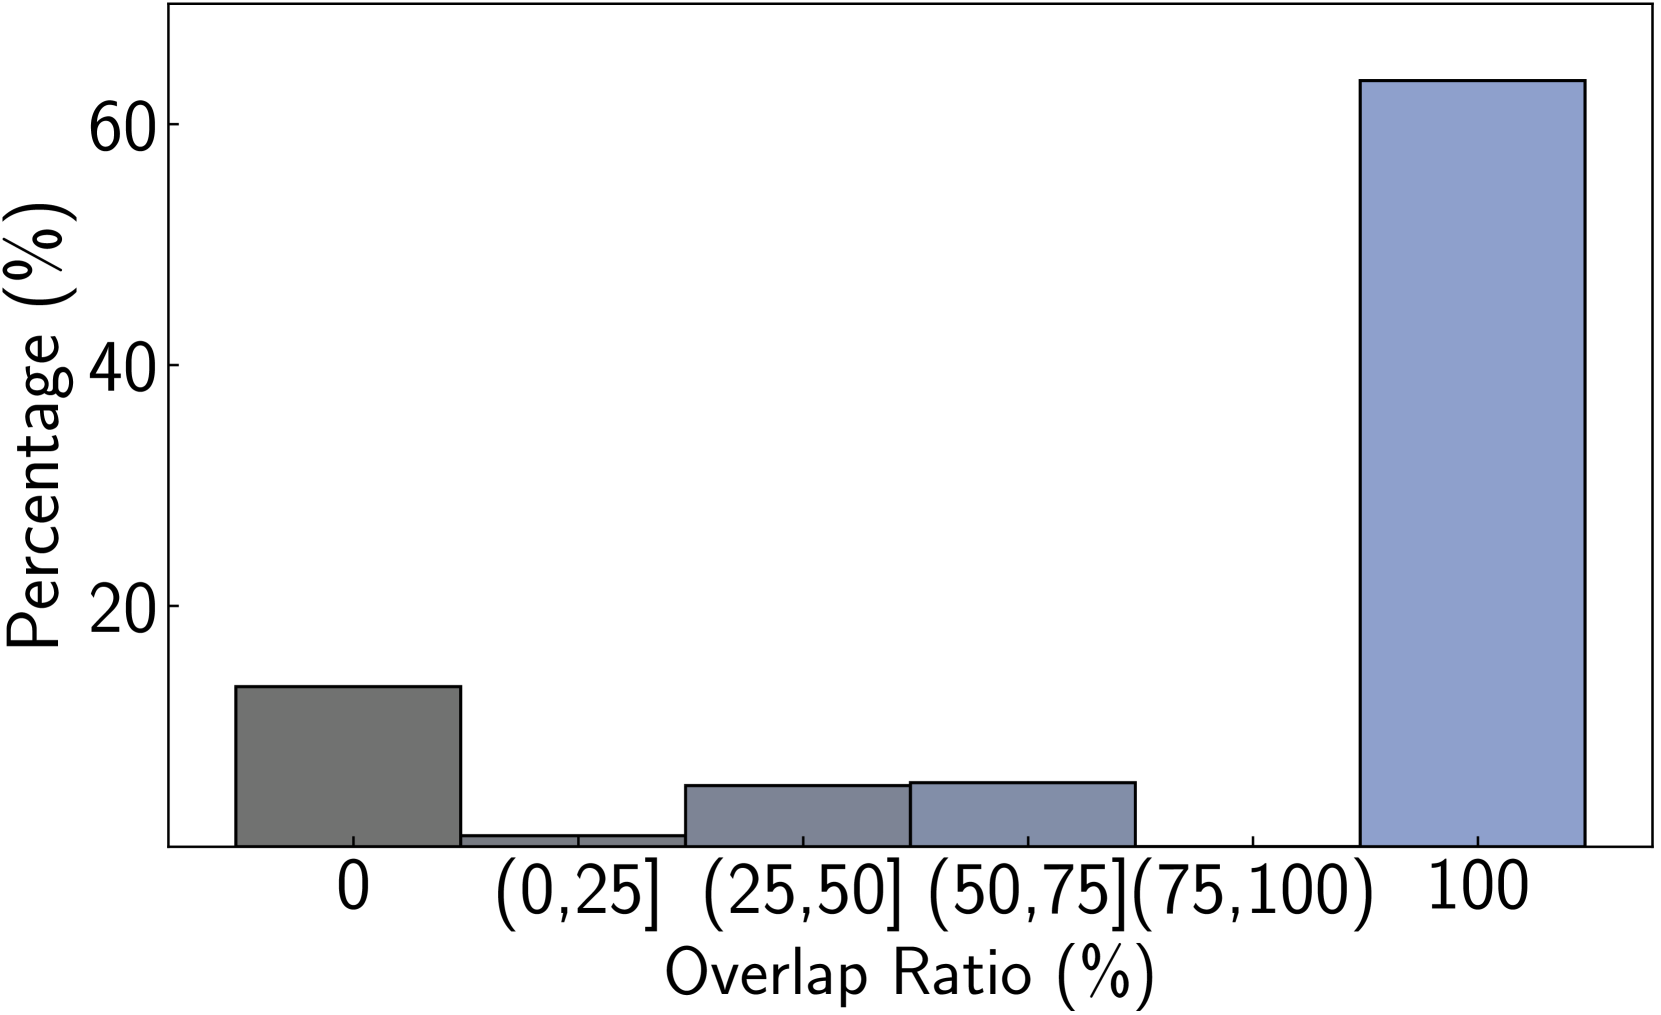
The chart displays the distribution of overlap ratios across six categories, with percentages ranging from 0% to 60%. The x-axis represents overlap ratio intervals, while the y-axis shows the corresponding percentage of occurrences. The tallest bar corresponds to the "100" category, indicating a dominant trend in maximum overlap.
### Components/Axes
- **X-axis (Overlap Ratio %)**: Categories labeled as `0`, `(0,25]`, `(25,50]`, `(50,75]`, `(75,100]`, and `100`.
- **Y-axis (Percentage %)**: Scale from 0% to 60% in increments of 20%.
- **Legend**: Located on the right, associating colors with categories:
- Dark Gray: `0`
- Gray: `(0,25]`
- Light Gray: `(25,50]`
- Blue: `(50,75]`
- Dark Blue: `(75,100]`
### Detailed Analysis
- **Bar 1 (0)**: Dark Gray, ~15% height.
- **Bar 2 (0,25]**: Gray, ~2% height.
- **Bar 3 (25,50]**: Light Gray, ~5% height.
- **Bar 4 (50,75]**: Blue, ~6% height.
- **Bar 5 (75,100]**: Dark Blue, ~63% height.
- **Bar 6 (100)**: Dark Blue, ~63% height.
### Key Observations
1. The `100` category (Dark Blue) dominates with ~63%, far exceeding all other categories.
2. The `0` category (Dark Gray) is the second-largest at ~15%.
3. Categories `(0,25]`, `(25,50]`, and `(50,75]` collectively account for ~13% (~2% + ~5% + ~6%).
4. The `100` category overlaps with the `(75,100]` label in the legend, suggesting a potential inconsistency in labeling.
### Interpretation
The data indicates a strong concentration of cases with maximum overlap (100%), which may reflect a systemic or design-driven phenomenon where full overlap is the norm. The `0` category’s 15% suggests a notable minority of instances with no overlap, possibly indicating edge cases or anomalies. The discrepancy between the `100` label and the `(75,100]` legend entry warrants clarification, as it could imply either a mislabeling error or intentional categorization of the `100` value as a distinct outlier. The sharp drop from 63% to 15% between the `100` and `0` categories highlights a bimodal distribution, emphasizing the prevalence of extreme overlap ratios.