## Line Chart: Accuracy vs. Model Size
### Overview
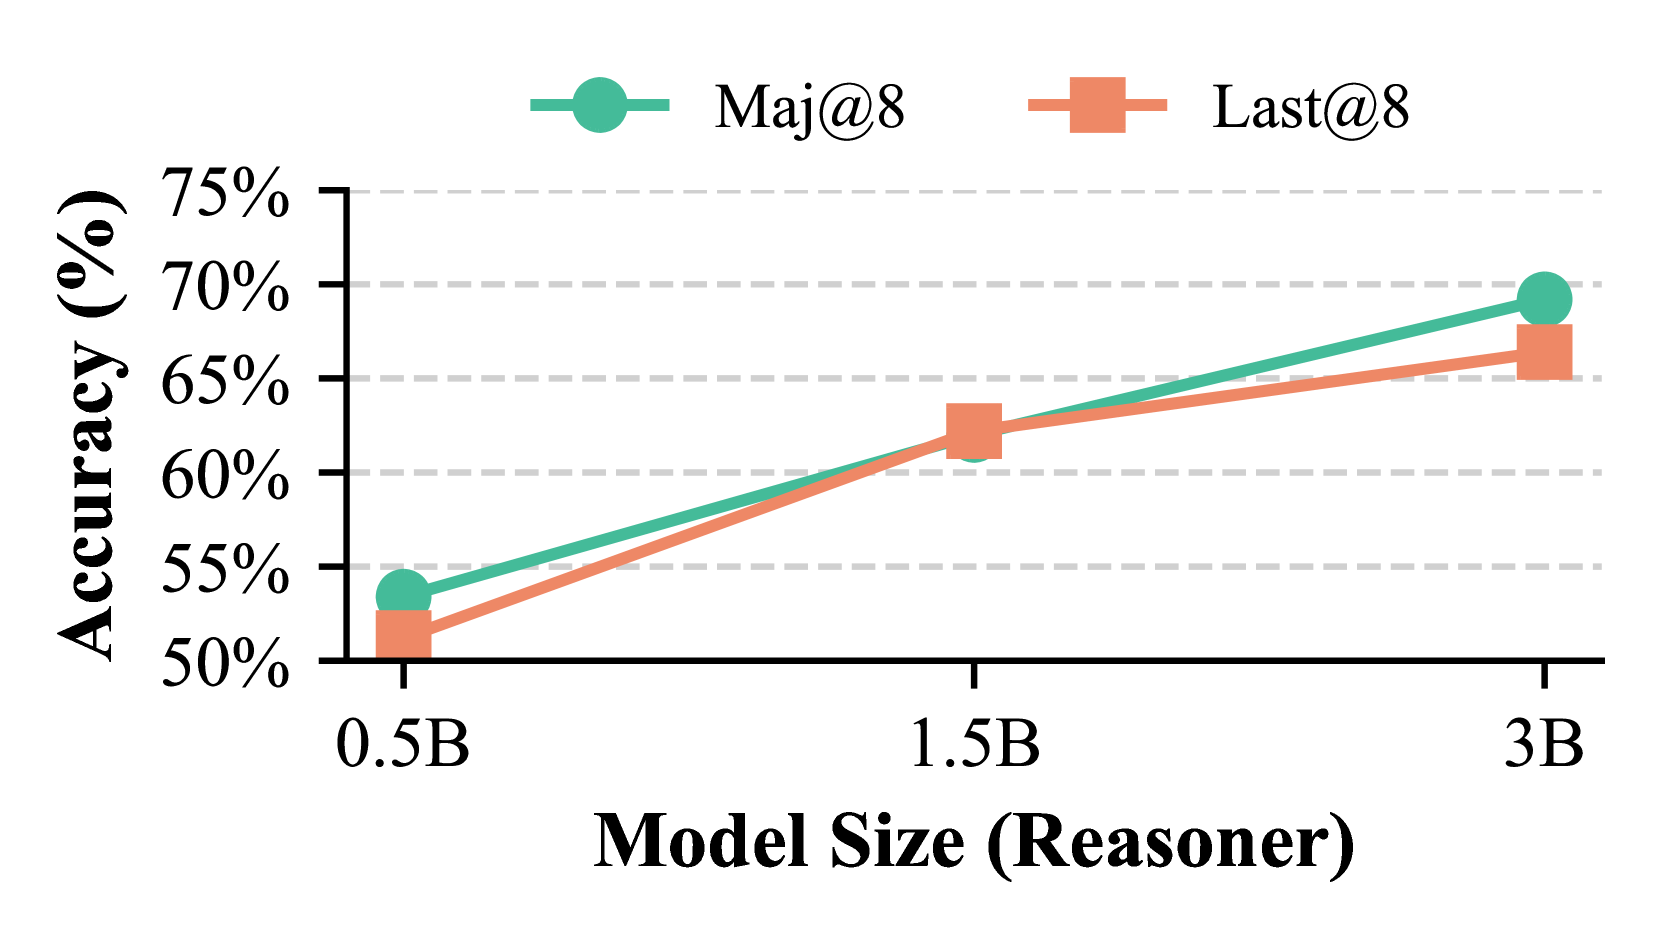
The image is a line chart comparing the accuracy of two methods, "Maj@8" and "Last@8", across different model sizes (0.5B, 1.5B, and 3B). The chart shows how accuracy changes as the model size increases for each method.
### Components/Axes
* **X-axis:** Model Size (Reasoner), with values 0.5B, 1.5B, and 3B.
* **Y-axis:** Accuracy (%), with values ranging from 50% to 75% in 5% increments.
* **Legend:** Located at the top of the chart.
* "Maj@8" is represented by a teal line with circle markers.
* "Last@8" is represented by a coral line with square markers.
* **Gridlines:** Horizontal dashed lines at each 5% increment on the y-axis.
### Detailed Analysis
* **Maj@8 (Teal Line):** The accuracy generally increases as the model size increases.
* At 0.5B, the accuracy is approximately 54%.
* At 1.5B, the accuracy is approximately 62%.
* At 3B, the accuracy is approximately 69%.
* **Last@8 (Coral Line):** The accuracy also increases as the model size increases.
* At 0.5B, the accuracy is approximately 52%.
* At 1.5B, the accuracy is approximately 62%.
* At 3B, the accuracy is approximately 67%.
### Key Observations
* Both methods show improved accuracy with larger model sizes.
* "Maj@8" consistently shows slightly higher accuracy than "Last@8" across all model sizes.
* The accuracy improvement from 1.5B to 3B is less pronounced than from 0.5B to 1.5B for both methods.
* At 1.5B, both methods have approximately the same accuracy.
### Interpretation
The chart suggests that increasing the model size (Reasoner) generally improves the accuracy of both "Maj@8" and "Last@8" methods. However, the gains in accuracy diminish as the model size increases further. The "Maj@8" method appears to be slightly more effective than the "Last@8" method, as it consistently achieves higher accuracy across the tested model sizes. The convergence of accuracy at 1.5B suggests a potential inflection point or a region where the methods perform similarly.