## Line Chart: Accuracy vs. Model Size
### Overview
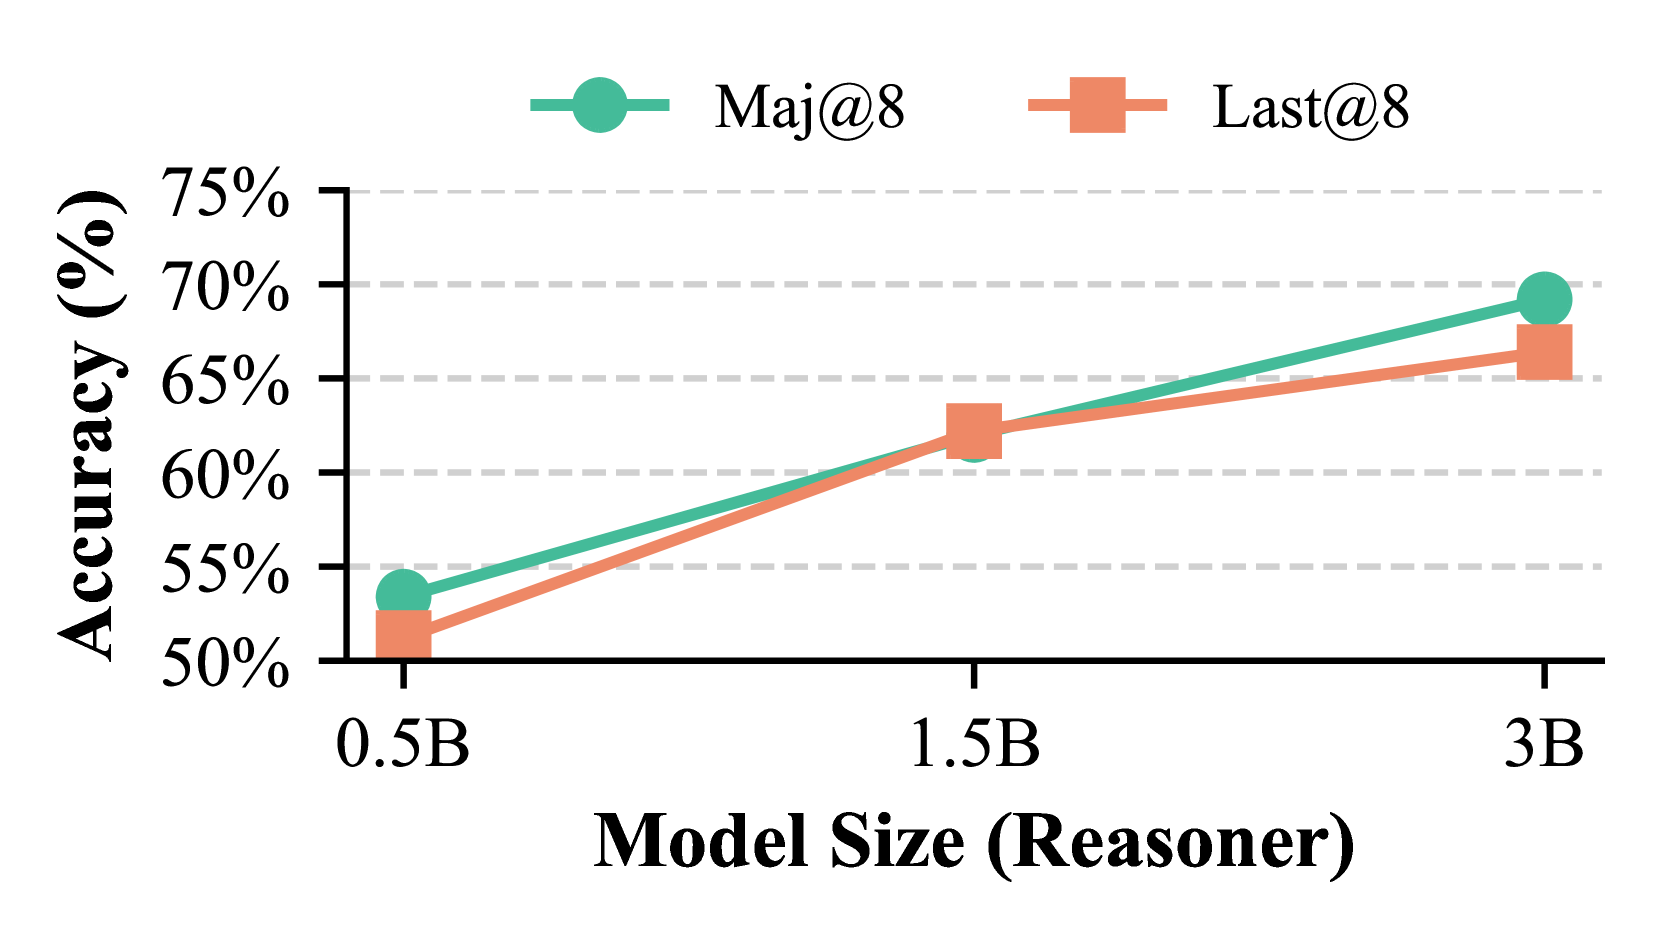
This image displays a line chart illustrating the relationship between "Model Size (Reasoner)" on the x-axis and "Accuracy (%)" on the y-axis. Two data series, "Maj@8" and "Last@8", are plotted, showing how their accuracy changes with increasing model size.
### Components/Axes
* **X-axis Title:** "Model Size (Reasoner)"
* **X-axis Markers:** "0.5B", "1.5B", "3B"
* **Y-axis Title:** "Accuracy (%)"
* **Y-axis Markers:** "50%", "55%", "60%", "65%", "70%", "75%"
* **Legend:** Located in the top-center of the chart.
* **"Maj@8"**: Represented by a teal-colored line with circular markers.
* **"Last@8"**: Represented by an orange-colored line with square markers.
### Detailed Analysis
The chart shows two lines, "Maj@8" (teal, circles) and "Last@8" (orange, squares), both exhibiting an upward trend in accuracy as the model size increases from 0.5B to 3B.
**Data Series: Maj@8 (Teal, Circles)**
* **Trend:** The "Maj@8" line slopes upward consistently across the observed model sizes.
* **Data Points (approximate):**
* At 0.5B model size: Approximately 54% accuracy.
* At 1.5B model size: Approximately 63% accuracy.
* At 3B model size: Approximately 70% accuracy.
**Data Series: Last@8 (Orange, Squares)**
* **Trend:** The "Last@8" line also slopes upward, mirroring the general trend of "Maj@8".
* **Data Points (approximate):**
* At 0.5B model size: Approximately 51% accuracy.
* At 1.5B model size: Approximately 62% accuracy.
* At 3B model size: Approximately 66% accuracy.
### Key Observations
* Both "Maj@8" and "Last@8" show a positive correlation between model size and accuracy.
* The "Maj@8" series consistently achieves higher accuracy than the "Last@8" series across all model sizes presented.
* The gap in accuracy between "Maj@8" and "Last@8" appears to widen slightly as the model size increases from 1.5B to 3B. At 0.5B, the difference is about 3%, at 1.5B it's about 1%, and at 3B it's about 4%.
### Interpretation
The data presented in this chart suggests that for both "Maj@8" and "Last@8" methods, increasing the model size (Reasoner) leads to improved accuracy. The "Maj@8" method appears to be more effective or robust, consistently outperforming "Last@8" across the tested model sizes. The widening gap at larger model sizes might indicate that "Maj@8" scales more favorably with increased model complexity compared to "Last@8". This implies that if computational resources allow, employing larger models with the "Maj@8" approach could yield significantly better results. The "Reasoner" in the x-axis title likely refers to a component or aspect of the model that is being scaled, and its size directly impacts the overall model's performance as measured by accuracy.